PyVista offers 3D plotting and mesh analysis through a streamlined interface for the Visualization Toolkit (VTK).
Read more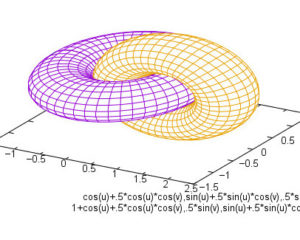
The Linux Portal Site
PyVista offers 3D plotting and mesh analysis through a streamlined interface for the Visualization Toolkit (VTK).
Read more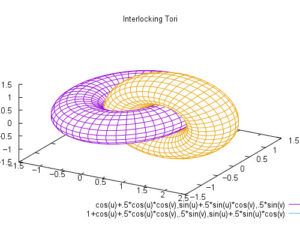
Plots is a graph plotting app for GNOME. Plots makes it easy to visualise mathematical formulae.
Read more
Big Data analysis can be performed with data mining software. Here’s the best free tools to perform data analysis on big data.
Read more
Google Charts lets users visualize data on their website. It offers a wide range of ready-to-use chart types.
Read more
This article recommends the best free and open source software key value stores for Big Data.
Read more
A proof assistant or interactive theorem prover is a software tool to assist with the development of formal proofs by human-machine collaboration.
Read more
The periodic table, in chemistry, is the organized array of all the chemical elements in order of increasing atomic number.
Read more
The Lean mathematical library, mathlib, is a unified library of mathematics formalized in the Lean proof assistant.
Read more
D3 (or D3.js) is a JavaScript library for visualizing data. Its low-level approach is built on web standards offers unparalleled flexibility.
Read more
Graph3d is an interactive visualization chart to draw data in a three dimensional graph. Graph3d uses HTML canvas to render graphs
Read more