Last Updated on November 25, 2022
CPU Stats
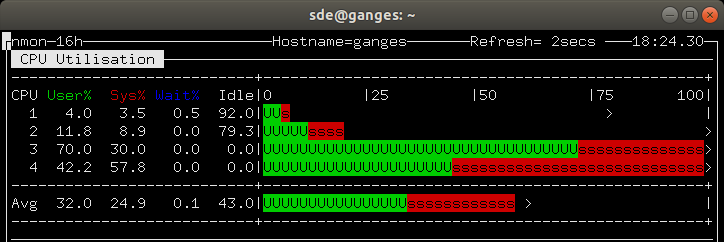
Press c (lower case), and you’re presented with CPU utilisation.
In the image below you can see our test system has 4 cores, with 2 of the cores maxed out. The image is showing that the processors are devoting 32% for user space processes — they are processes that don’t belong to the kernel. There’s 24.9% of the CPUs spent running the kernel, and 0.5% where one of the CPUs idled waiting for an Input/Output operation to complete. The horizontal ASCII bars clearly illustrate the information visually. User time is shown with U’s on a green background. System time is shown with s’s on a red background. Wait and idle times would be displayed in their corresponding colors with a w and i respectively.

The image below shows the information presented in a different way. It’s accessed by pressing U (capital u). Strangely, on our Ubuntu 18.10 system, the Guest VM stats didn’t display correctly.

You’ll notice the images above were captured at different times, and hence display different statistics. But you can show both views in a single terminal, by first pressing c and then U. In fact, this applies to all the other system information. For example, you can show CPU, memory, and disk information in a single window. This makes the tool extremely customizable, displaying exactly the information you want to monitor. This is one of nmon’s real strengths.
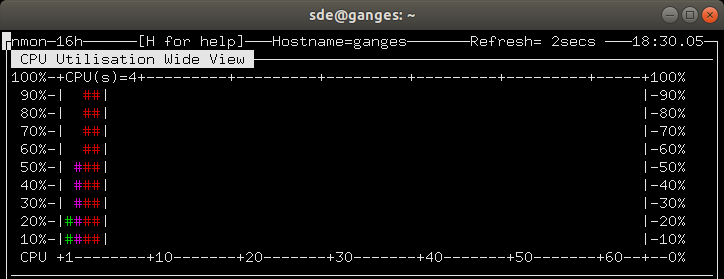
If you need to monitor a system with a large number of processors, such as a cluster, you’ll welcome the CPU Utilisation Wide View, accessed by pressing C.

As our test machine offers a mere 4 cores, the wide view isn’t terribly useful. But even on the desktop, both AMD and Intel keep scaling up the core count of their flagship processors. For example, the Ryzen Threadripper 2990WX boasts 32 cores. So you may find this view really useful.
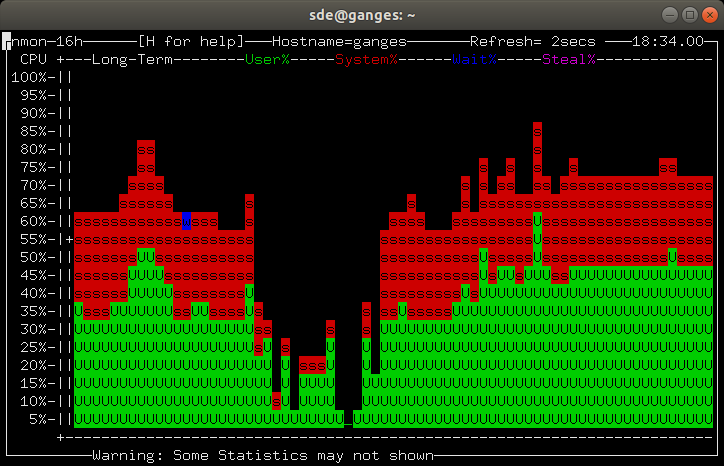
We’ll look at one final CPU view. This is the longer term CPU averages (accessed by pressing l). It’s a a combination of a real-time chart and a history or long-term view of the CPU stats. It shows the % of the CPUs used over an interval of slightly more than 2 minutes. It’s visually the most appealing.

Next page: Page 4 – Memory Stats
Pages in this article:
Page 1 – Introduction / Installation
Page 2 – In Operation
Page 3 – CPU Stats
Page 4 – Memory Stats
Page 5 – Disk Stats
Page 6 – Kernel Internal Stats
Page 7 – Virtual Memory Stats
Page 8 – Network Stats
Page 9 – Top-processes
Page 10 – Resources
Page 11 – Summary

What terminal/window settings do I use in PuTTY when running nmon to get the correct line drawing?