Last Updated on November 25, 2022
Disk Stats
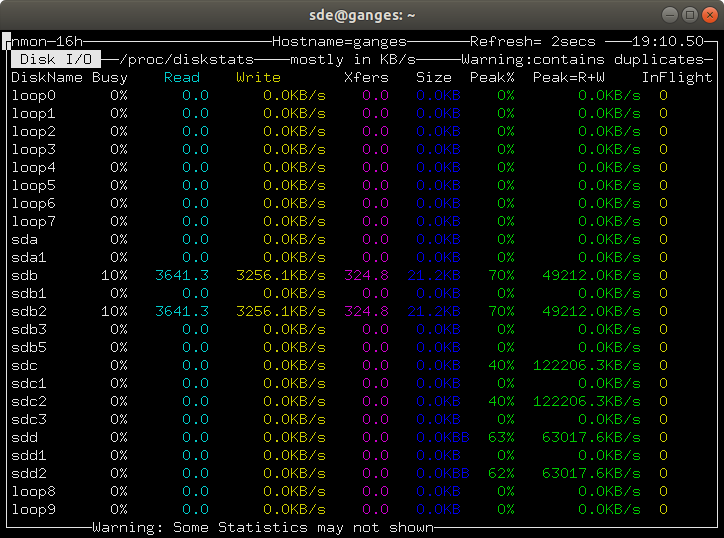
Pressing d key shows Disk Input/Output graphs. We prefer the statistics shown by pressing D.
Nmon is designed to show all mounted filesystems. There’s lots of loop devices shown in the image below which clutters up the information. A loop device is a pseudo-device that makes a file accessible as a block device. On our test machine, they’re a consequence of using snaps. Each individual snap is a read-only squashfs filesystem image. This list of mounted loop devices therefore effectively includes the snaps installed.

For each disk, there are statistics showing the read and write speed, together with peak figures. If you’ve got systems with lots of storage, nmon is an effective way of monitoring storage device usage.
Pressing o displays a Disk %Busy map (for space reasons, this is not shown here).
Next page: Page 6 – Kernel Internal Stats
Pages in this article:
Page 1 – Introduction / Installation
Page 2 – In Operation
Page 3 – CPU Stats
Page 4 – Memory Stats
Page 5 – Disk Stats
Page 6 – Kernel Internal Stats
Page 7 – Virtual Memory Stats
Page 8 – Network Stats
Page 9 – Top-processes
Page 10 – Resources
Page 11 – Summary

What terminal/window settings do I use in PuTTY when running nmon to get the correct line drawing?