In Operation
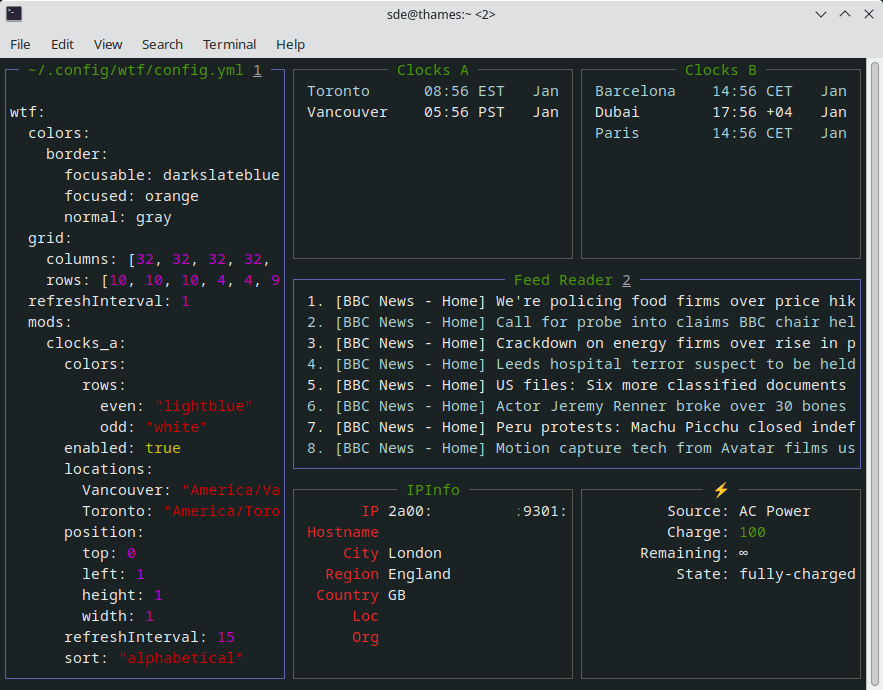
Here’s an image of WTF with a default configuration.

As the image shows, we’re presented with a number of widgets showing various information. The left panel shows a text file (it’s the config.yml to configure the program). The other panels are showing time clocks, a news feed, IP information (which we redacted some of the information), and battery information.
The widgets that you see on the screen are displayed using modules. The real power of WTF is these modules. They are chunks of functionality that let you tailor the information to your precise requirements. A module is a discrete unit of functionality that extracts data from a source and packages that data for display.
Modules are added and configured by including specific lines of text in your config.yml file. In the image below, we’re starting to configure WTF. We’ve taken one of the sample configs available from the project’s GitHub repository, and added a feed reader to our RSS feed which is available at https://www.linuxlinks.com/feed/ and positioned it in the top right hand corner.

There are many modules available which are easily added by inserting specific code in the config file. That file lets us define where each module appears, defines the number of rows and columns and the widget height and width.
Pages in this article:
Page 1 – Introduction / Installation
Page 2 – In Operation
Page 3 – Summary
Complete list of articles in this series:
| Essential System Tools | |
|---|---|
| Alacritty | Innovative, hardware-accelerated terminal emulator |
| BleachBit | System cleaning software. Quick and easy way to service your computer |
| bottom | Process/system monitor for the terminal |
| btop++ | Monitor usage and stats for CPU, memory, disks, network and processes |
| catfish | Versatile file searching software |
| Clonezilla | Partition and disk cloning software |
| CPU-X | System profiler with both a GUI and text-based |
| Czkawka | Find duplicate files, big files, empty files, similar images, and much more |
| ddrescue | Data recovery tool, retrieving data from failing drives as safely as possible |
| dust | More intuitive version of du written in Rust |
| f3 | Detect and fix counterfeit flash storage |
| Fail2ban | Ban hosts that cause multiple authentication errors |
| fdupes | Find or delete duplicate files |
| Firejail | Restrict the running environment of untrusted applications |
| Glances | Cross-platform system monitoring tool written in Python |
| GParted | Resize, copy, and move partitions without data |
| GreenWithEnvy | NVIDIA graphics card utility |
| gtop | System monitoring dashboard |
| gWakeOnLAN | Turn machines on through Wake On LAN |
| hyperfine | Command-line benchmarking tool |
| HyFetch | System information tool written in Python |
| inxi | Command-line system information tool that's a time-saver for everyone |
| journalctl | Query and display messages from the journal |
| kmon | Manage Linux kernel modules with this text-based tool |
| Krusader | Advanced, twin-panel (commander-style) file manager |
| Nmap | Network security tool that builds a "map" of the network |
| nmon | Systems administrator, tuner, and benchmark tool |
| nnn | Portable terminal file manager that's amazingly frugal |
| pet | Simple command-line snippet manager |
| Pingnoo | Graphical representation for traceroute and ping output |
| ps_mem | Accurate reporting of software's memory consumption |
| SMC | Multi-featured system monitor written in Python |
| Timeshift | Reliable system restore tool |
| QDirStat | Qt-based directory statistics |
| QJournalctl | Graphical User Interface for systemd’s journalctl |
| TLP | Must-have tool for anyone running Linux on a notebook |
| Unison | Console and graphical file synchronization software |
| VeraCrypt | Strong disk encryption software |
| Ventoy | Create bootable USB drive for ISO, WIM, IMG, VHD(x), EFI files |
| WTF | Personal information dashboard for your terminal |

