Last Updated on December 21, 2024
In Operation: Performance tab
The interface groups the functions into 3 tabs. Let’s take a look at the first one: Performance.
The devices run down the sidebar. The interface lets you hide and rearrange devices.
CPU
By default, the program shows CPU usage as an aggregate. We can monitor system processes, threads, and handles count, uptime, clock speed (base and current), cache sizes, and other information.
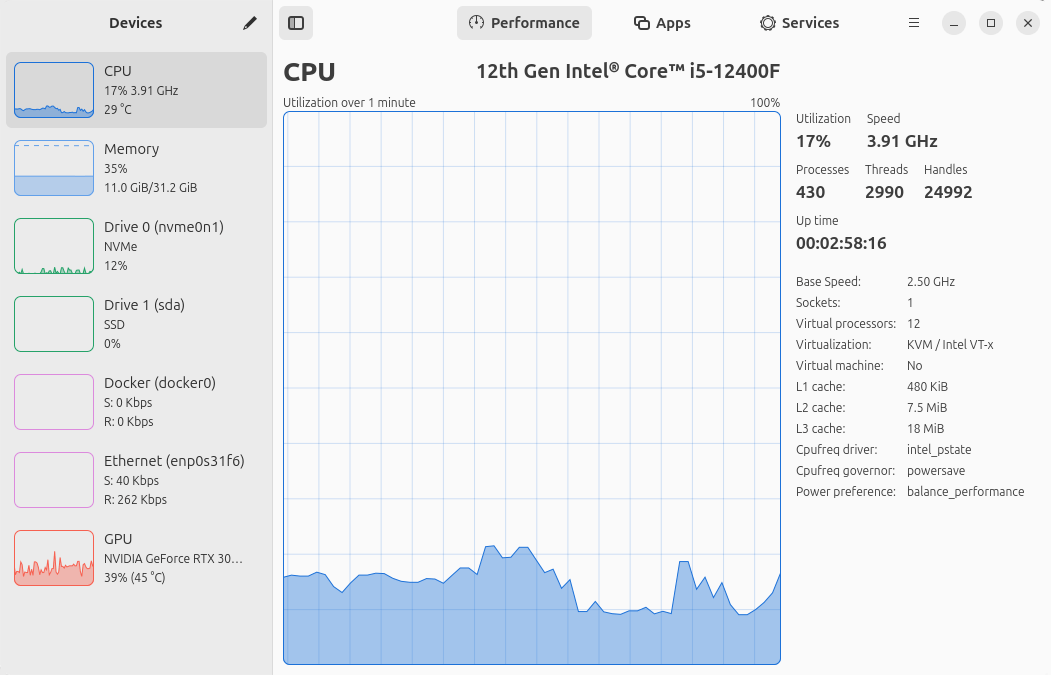
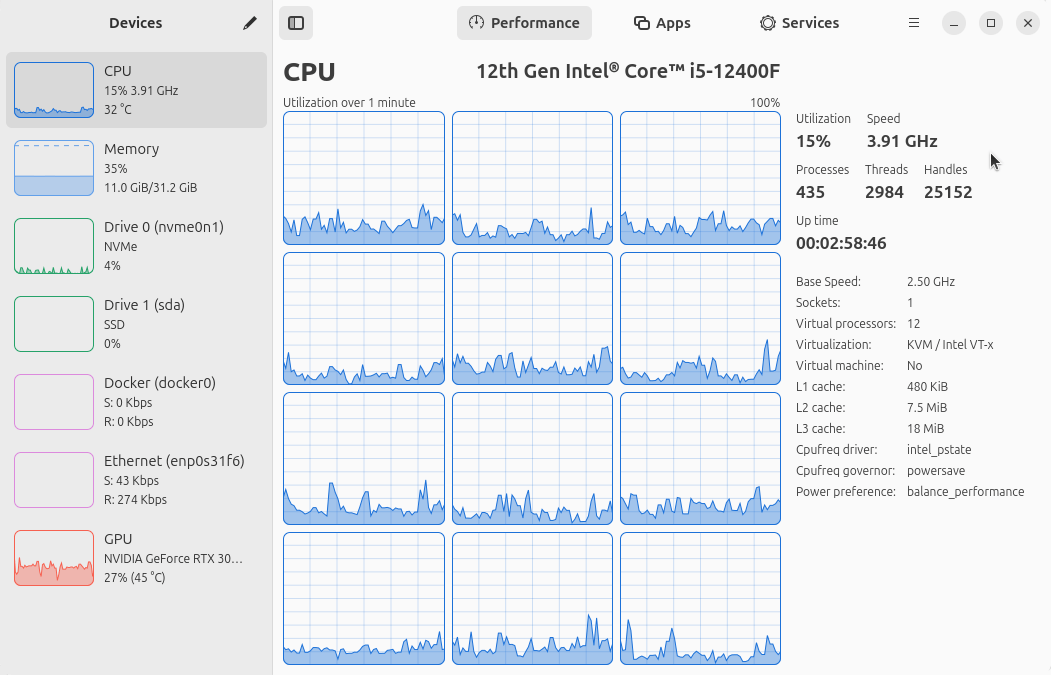
Our test machine has a CPU with 6 P-cores with hyperthreading, making a total of 12 threads. The software also lets us monitor per-thread CPU usage.
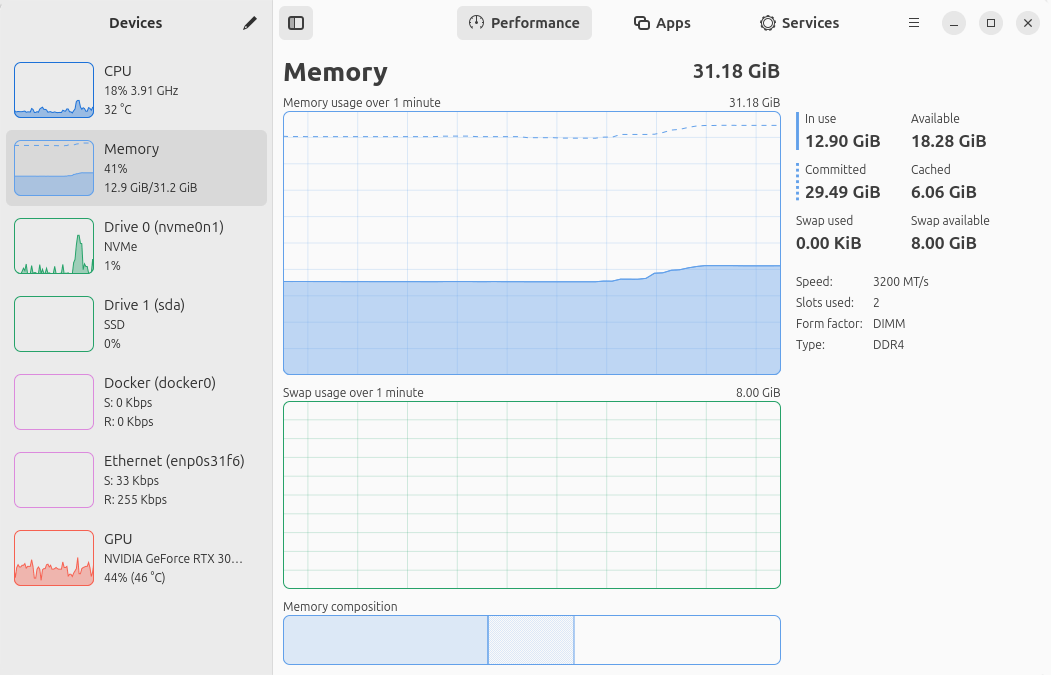
Memory
This section lets us monitor both memory and swap usage. The machine has 32GB of RAM (2 sticks of 16GB of DDR4 RAM) and an 8GB swap file.
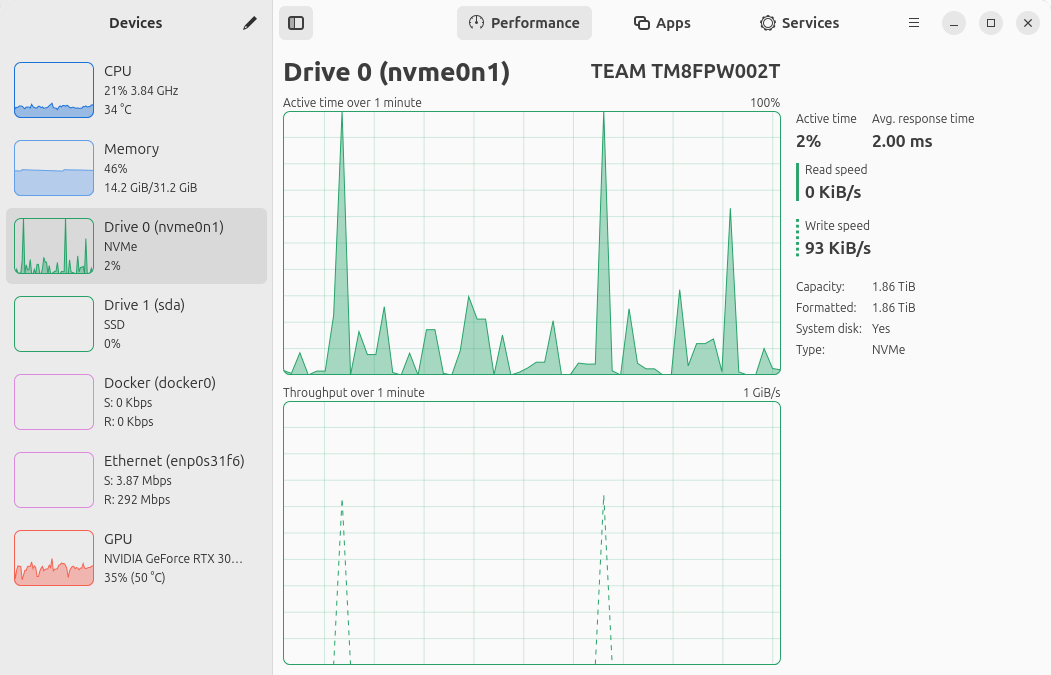
Drive
Here we can monitor disk utilization and transfer rates for both internal and external drives.
Ethernet
This part lets you monitor network utilization and transfer speeds. We can see network interface information such as network card name, connection type (Wi-Fi or Ethernet), wireless speeds and frequency, hardware address, as well as IP address.
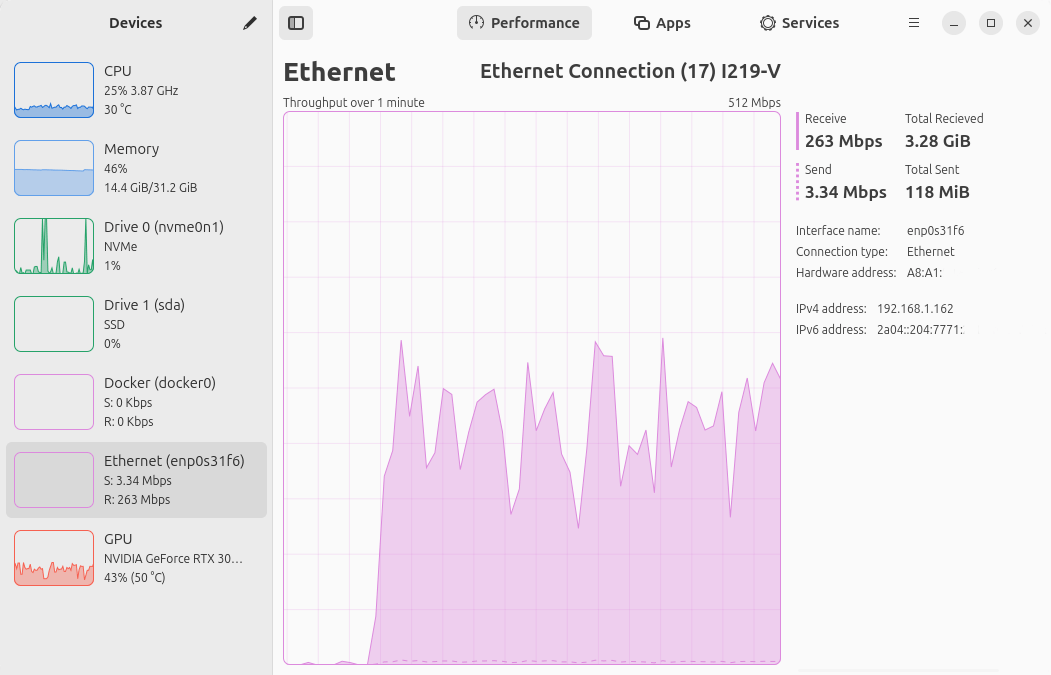
We’re not showing a Wi-Fi section in the images as the test machine only has ethernet. But we’ve also tested the utility with mini PCs which have wireless.
Graphics
This section lets you monitor overall GPU usage, video encoder and decoder usage, memory usage and power consumption. Rather than try to reinvent the wheel, the program calls NVTOP, an (h)top like task monitor for AMD, Intel and NVIDIA GPUs.
Some of the information displayed is dependent on the manufacturer. For example for AMD GPUs, there’s support for zenpower when monitoring AMD CPU temperature. This information is not shown in the image below, as the host machine has an NVIDIA GPU.
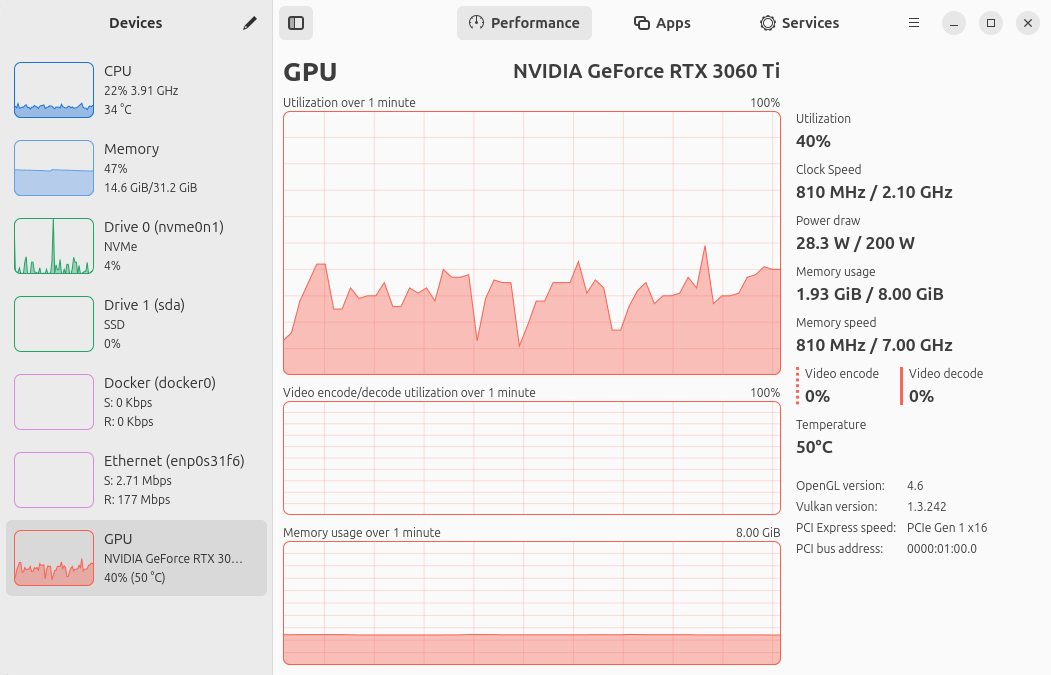
Not shown in the images is a fan page that monitors system fans and reports RPM, PWN, and temperature information.
Next page: Page 3 – In Operation: Apps tab
Pages in this article:
Page 1 – Introduction and Installation
Page 2 – In Operation: Performance tab
Page 3 – In Operation: Apps tab
Page 4 – In Operation: Services tab
Page 5 – Preferences and Summary
