PyQtGraph is a pure-python graphics and GUI open source library built on PyQt4 / PySide and NumPy. It’s intended for use in mathematics, scientific, and engineering applications.
Despite being written entirely in Python, the library is very fast due to its heavy leverage of NumPy for number crunching and Qt’s GraphicsView framework for fast display.
PyQtGraph makes extensive use of Qt for generating nearly all of its visual output and interfaces.
Key Features
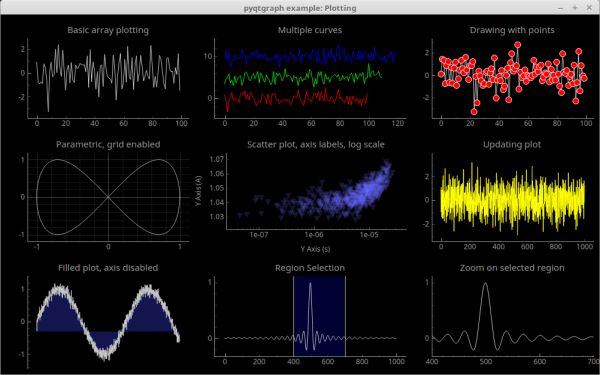
- Basic 2D plotting in interactive view boxes:
- Line and scatter plots;
- Data can be panned/scaled by mouse;
- Fast drawing for real-time data display and interaction.
- Image display with interactive lookup tables and level control:
- Displays most data types (int or float; any bit depth; RGB, RGBA, or luminance);
- Functions for slicing multidimensional images at arbitrary angles (great for MRI data);
- Rapid update for video display or real-time interaction.
- 3D graphics system (requires Python-OpenGL bindings):
- Volumetric data rendering;
- 3D surface and scatter plots;
- Mesh rendering with isosurface generation, per-vertex normals;
- Interactive viewports rotate/zoom with mouse;
- Basic 3D scenegraph for easier programming. Scenegraph allowing items to be added/removed from scene with per-item transformations and parent/child relationships;
- Triangular meshes;
- Grid/axis items.
- Data selection/marking and region-of-interest controls:
- Interactively mark vertical/horizontal locations and regions in plots;
- Widgets for selecting arbitrary regions from images and automatically slicing data to match.
- Easy to generate new graphics:
- 2D graphics use Qt’s GraphicsView framework which is highly capable and mature;
- 3D graphics use OpenGL;
- All graphics use a scenegraph for managing items; new graphics items are simple to create.
- Library of widgets and modules useful for science/engineering applications:
- Flowchart widget for interactive prototyping;
- Interface similar to LabView (nodes connected by wires);
- Parameter tree widget for displaying/editing hierarchies of parameters
(similar to those used by most GUI design applications); - Interactive Python console with exception catching;
good for debugging/introspection as well as advanced user interaction. - Multi-process control allowing remote plotting, Qt signal connection across processes, and very simple in-line parallelization;
- Dock system allowing the user to rearrange GUI components; Similar to Qt’s dock system but a little more flexible and programmable.
- Color gradient editor;
- SpinBox with SI-unit display and logarithmic stepping.
PyQtGraph depends on:
- Python 2.7 or Python 3.x;
- A Qt library such as PyQt4, PyQt5, or PySide;
- numpy.
Website: www.pyqtgraph.org
Support: Documentation, GitHub Code Repository
Developer: Luke Campagnola and contributors
License: MIT License
PyQtGraph is written in Python. Learn Python with our recommended free books and free tutorials.
Related Software
| Plotting Tools | |
|---|---|
| matplotlib | Python based plotting system in a style similar to Matlab |
| ggplot2 | Powerful R package for declaratively creating graphics |
| gnuplot | Command-line driven interactive plotting program |
| ROOT | Solves the data analysis challenges of high-energy physics |
| Octave | Built-in plotting and visualization tools |
| DataMelt | Produces professional graphics with libraries for data manipulation |
| Veusz | Scientific plotting and graphing program |
| LabPlot | Data plotting and function analysis tool for KDE |
| PyQtGraph | Scientific Graphics and GUI Library for Python |
| Makie | interactive data visualizations and plotting for Julia |
| GLE | Graphics Layout Engine |
| PyVista | 3D plotting and mesh analysis |
| PLplot | Scientific plotting library |
| AlphaPlot | Fork of SciDAVis |
| SciDAVis | Scientific Data Analysis and Visualization |
| RLPlot | Generate publication quality graphs |
| Genius | Educational tool in mathematics and for research |
| ZeGrapher | 2D math and data plotter |
| Uniplot | Lightweight terminal plotting library for Python |
| Kst | Real-time large dataset viewing and plotting tool |
| Ctioga2 | Command-line plotting utility |
| Plots | Simple graph plotting app for GNOME |
| brplot | Ssmall application and library that plots data |
| SSPlot | Simple plotting utility and numerical simulator |
| Charta | Generate colorful terminal graphs |
| Incplot | Command like tool for drawing great looking plots in the terminal |
Read our verdict in the software roundup.
| Python Visualization Packages | |
|---|---|
| matplotlib | Python 2D plotting library which produces publication quality figures |
| Diagrams | Draw the cloud system architecture in Python code |
| Bokeh | Elegant, concise construction of versatile graphics |
| Dash | Python framework for building analytical web applications |
| seaborn | Python visualization library based on matplotlib |
| Plotly | Interactive, browser-based graphing library for Python |
| VisPy | Visualize massive datasets in real time |
| Vega-Altair | Declarative Visualization in Python |
| plotnine | Grammar of graphics for Python |
| PyQtGraph | Python graphics and GUI library built on PyQt4 / PySide and numpy |
| bqplot | Interactive Plotting Framework for the Jupyter Notebook |
| Vaex | Fast visualization of big data |
| folium | Visualize data in a Leaflet map |
| HoloViews | Make Data Analysis and Visualization Seamless |
| Datashader | Generates aggregate arrays and representations of them as images |
| yt | Multi-code Toolkit for Analyzing and Visualizing Volumetric Data |
| Glumpy | Intuitive interface between NumPy and modern OpenGL |
| GeoViews | Explore and visualize geographical, meteorological, and oceanographic datasets |
| Pygal | Dynamic SVG charting library |
| Glue | Multi-dimensional linked-data exploration |
Read our verdict in the software roundup.
 Explore our comprehensive directory of recommended free and open source software. Our carefully curated collection spans every major software category. Explore our comprehensive directory of recommended free and open source software. Our carefully curated collection spans every major software category.This directory is part of our ongoing series of informative articles for Linux enthusiasts. It features hundreds of detailed reviews, along with open source alternatives to proprietary solutions from major corporations such as Google, Microsoft, Apple, Adobe, IBM, Cisco, Oracle, and Autodesk. You’ll also find interesting projects to try, hardware coverage, free programming books and tutorials, and much more. Discovered a useful open source Linux program that we haven’t covered yet? Let us know by completing this form. |