Last Updated on July 11, 2020
R and RStudio
This is a short introductory training session on the use of R in data science.
R is a statistical programming language that can be used for data manipulation, visualisation of data and statistical analysis. The R language consists of a set of tokens and keywords and a grammar that you can use to explore and understand data from many different sources.
We focus on a common task in data science: import a data set, manipulate its structure, and then visualise the data. We shall use R and RStudio to accomplish this task.
RStudio is an integrated development environment (IDE) that can be used to carry out data science tasks using R. It contains an editor for R scripts, a console to interact directly with the R interpreter, and a file manager similar to that available in your operating system.
This is an interactive training session, so you should try to follow along with the tutorial.
Before we start, you’ll need the following software installed on your system:
- RStudio. Install the program with your distribution’s package manager.
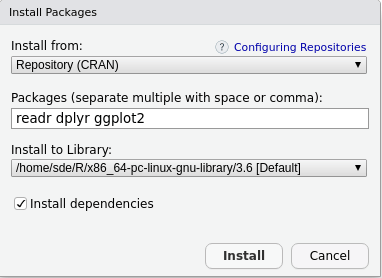
- The R packages readr, dplyr, and ggplot2. These packages are compiled and installed within RStudio. In the RStudio application, click on “Tools > Install Packages. In the Packages box type: “readr dplyr ggplot”, as shown in the screen shot below.

Let’s start RStudio. From your menu, click RStudio, or launch the program from a terminal. RStudio application should open.
An RStudio project
An RStudio project allows us to organise files and data in RStudio using a directory on the file system. It is best to create a project for each piece of data analysis that you carry out, so we shall create a project for this training session.
In the RStudio application, click on “File > New Project… > New Directory > New Project”. Type the project name “RIntro” into the directory name box and click on “Create Project”. This will start up a new RStudio session.
Download the training material:
- Our training session – Notes.html
- The data set – titanic.csv
Next we copy the given training materials into the project. Click on the “More” button in the “Files” tab and select “Show Folder in New Window”. This should open the file manager at the project directory. Copy the training materials into this folder.
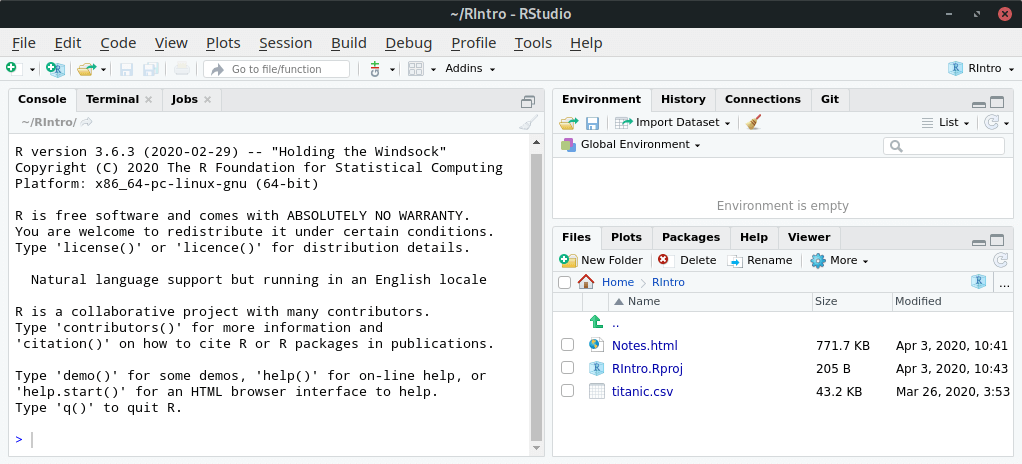
The RStudio application should now look like the screen shot below.

From RStudio, open the notes by left clicking on “Notes.html” and then selecting “View in Web Browser”.
You are now ready to start the training session by going through Notes.html in RStudio.


I completed this tutorial yesterday. A very good short introduction to get a taste of R, how it can be used in data analysis, and how graphical output can be produced and refined from that analysis. It teaches, by example, just enough to get you started using R for yourself for straight-forward data analysis of clean CSV data.
Highly recommended if teaching by example works for you.
This tutorial is excellent. Thanks!