Last Updated on September 1, 2020
Stacer: Dashboard
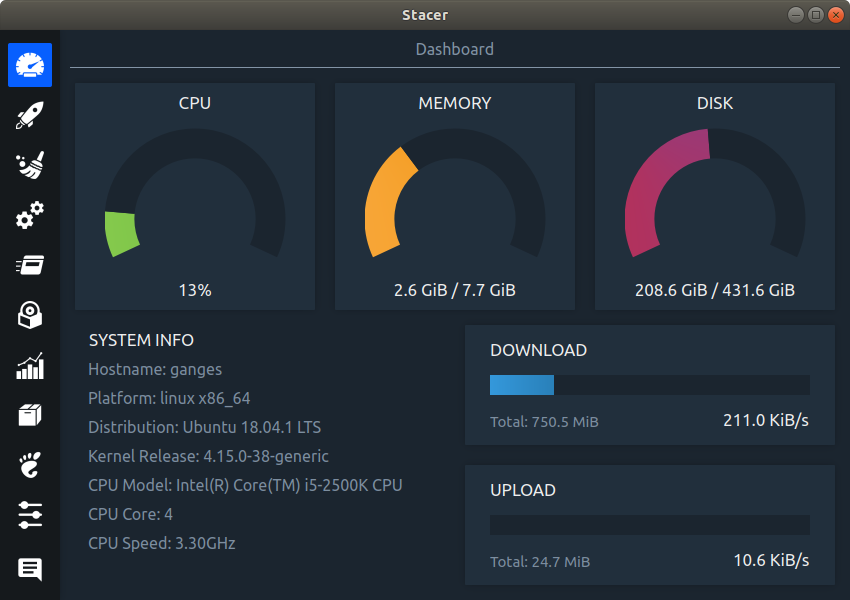
In the Dashboard you’ll see the current state of CPU, memory, and disk usage. There’s also bars showing network download and upload statistics, together with basic system information.

MY VIEW
The dashboard is attractive and conveys useful information. The CPU panel shows the overall processor usage although on multi-core machines there’s no way of displaying each core. Only one disk is reported by the dashboard, but you can change the disk in the Disk section from the Settings panel, although that’s not immediately obvious. I’d prefer an option to show all drives.
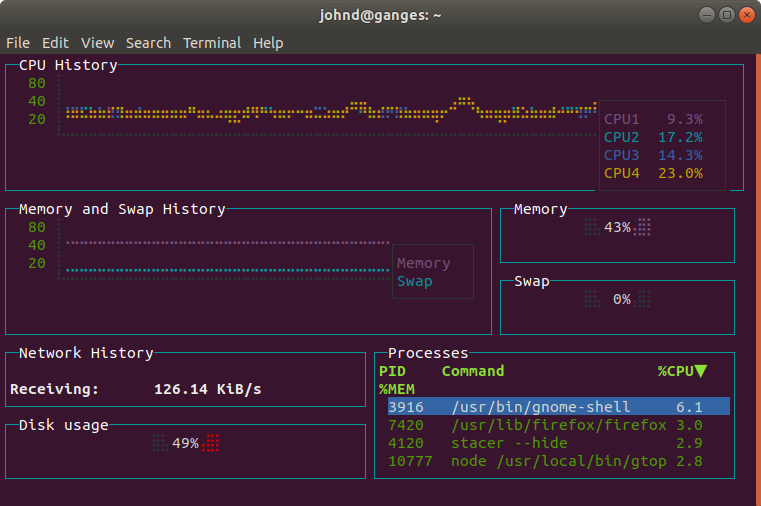
Stacer doesn’t replace my favorite dashboard utility, gtop. As you can see from the image below, gtop is visually less appealing, but it offers a bit more information in the dashboard, showing the CPU usage of each core, as well as process information.

gtop lacks system information. But the system information offered by Stacer is very limited. I’d remove the SYSTEM INFO title which serves no purpose. The platform and distribution lines would be better conveyed under a single line. And there’s no information about the graphics card, screen resolution, desktop environment etc.
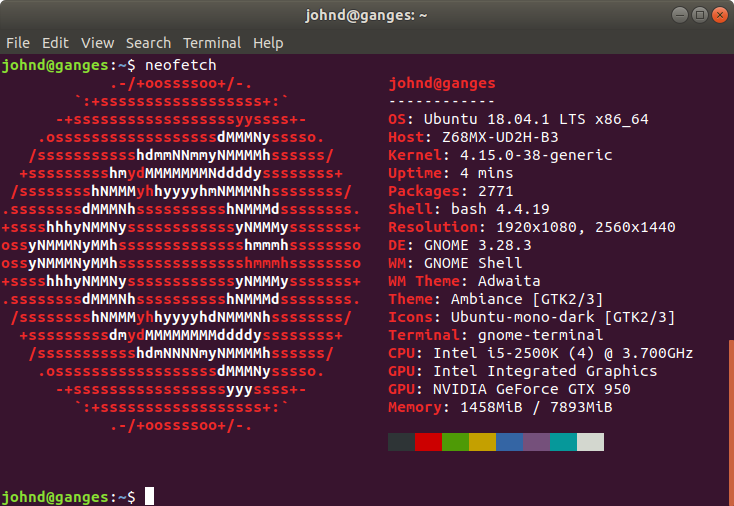
There’s better standalone tools that offer more information about a system together with flexibility to tailor that information to your requirements. One such tool is neofetch, a highly customizable system information script. Here’s some neofetch output.

Next page: Page 3 – Startup Apps
Pages in this article:
Page 1 – Intro
Page 2 – Dashboard
Page 3 – Startup Apps
Page 4 – System Cleaner
Page 5 – Services
Page 6 – Processes
Page 7 – Uninstaller
Page 8 – Resources
Page 9 – APT Repository Manager
Page 10 – Gnome Settings
Page 11 – Settings
Page 12 – Summary

ppa doen’t work….