Kst is a plotting tool written in C++ that provides both a command-line interface and a graphical user interface.
Read more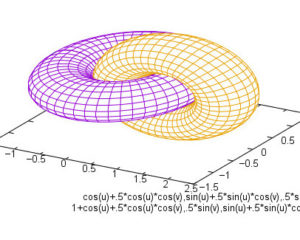
The Linux Portal Site
Kst is a plotting tool written in C++ that provides both a command-line interface and a graphical user interface.
Read more
AlphaPlot is a computer program for interactive scientific graphing and data analysis. It can generate different types of 2D and 3D plots.
Read more
A plotting tool is computer software which helps to analyse and visualize data, often of a scientific nature. Here’s our verdict.
Read more
PyVista offers 3D plotting and mesh analysis through a streamlined interface for the Visualization Toolkit (VTK).
Read more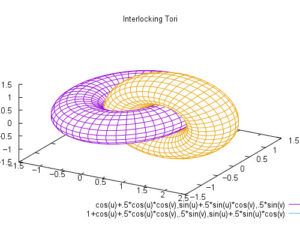
Plots is a graph plotting app for GNOME. Plots makes it easy to visualise mathematical formulae.
Read more
Python has a fantastic range of packages to produce mesmerizing visualizations. We recommend the best free and open source Python tools.
Read more
gnuplot is a command-driven interactive function plotting program. Plot functions and data points in both 2D and 3D plots in many formats.
Read more
ggplot2 is a system for declaratively creating graphics, based on The Grammar of Graphics, the idea that you can build every graph from the same few components.
Read more
PLplot is a scientific plotting package. It is relatively small, portable, freely distributable, and is rich enough to satisfy most users.
Read more
Veusz is a scientific plotting and graphing program with a graphical user interface, designed to produce publication-ready 2D and 3D plots.
Read more