
Benchmarks
We tested the drive with KDiskMark, a free and open source graphical frontend to Flexible I/O. The software provides an easy to view and interpret comprehensive benchmark result.
We benchmarked the SSD using a desktop with an ASUS motherboard and Intel 13th generation CPU, 64GB of RAM and an NVIDIA GeForce discrete graphics card. We also tested the SSD with an Intel NUC 13 Pro Mini PC.
Here are the results for the M200 1TB NVMe with the 13th generation machine. To put the results into context, we also benchmarked a Crucial BX500 SSD placed in a portable enclosure, as well as a WD 2TB My Passport Portable HDD. For benchmarking purposes, the drives are used as storage only, with the operating system (Linux naturally) running on a separate drive.
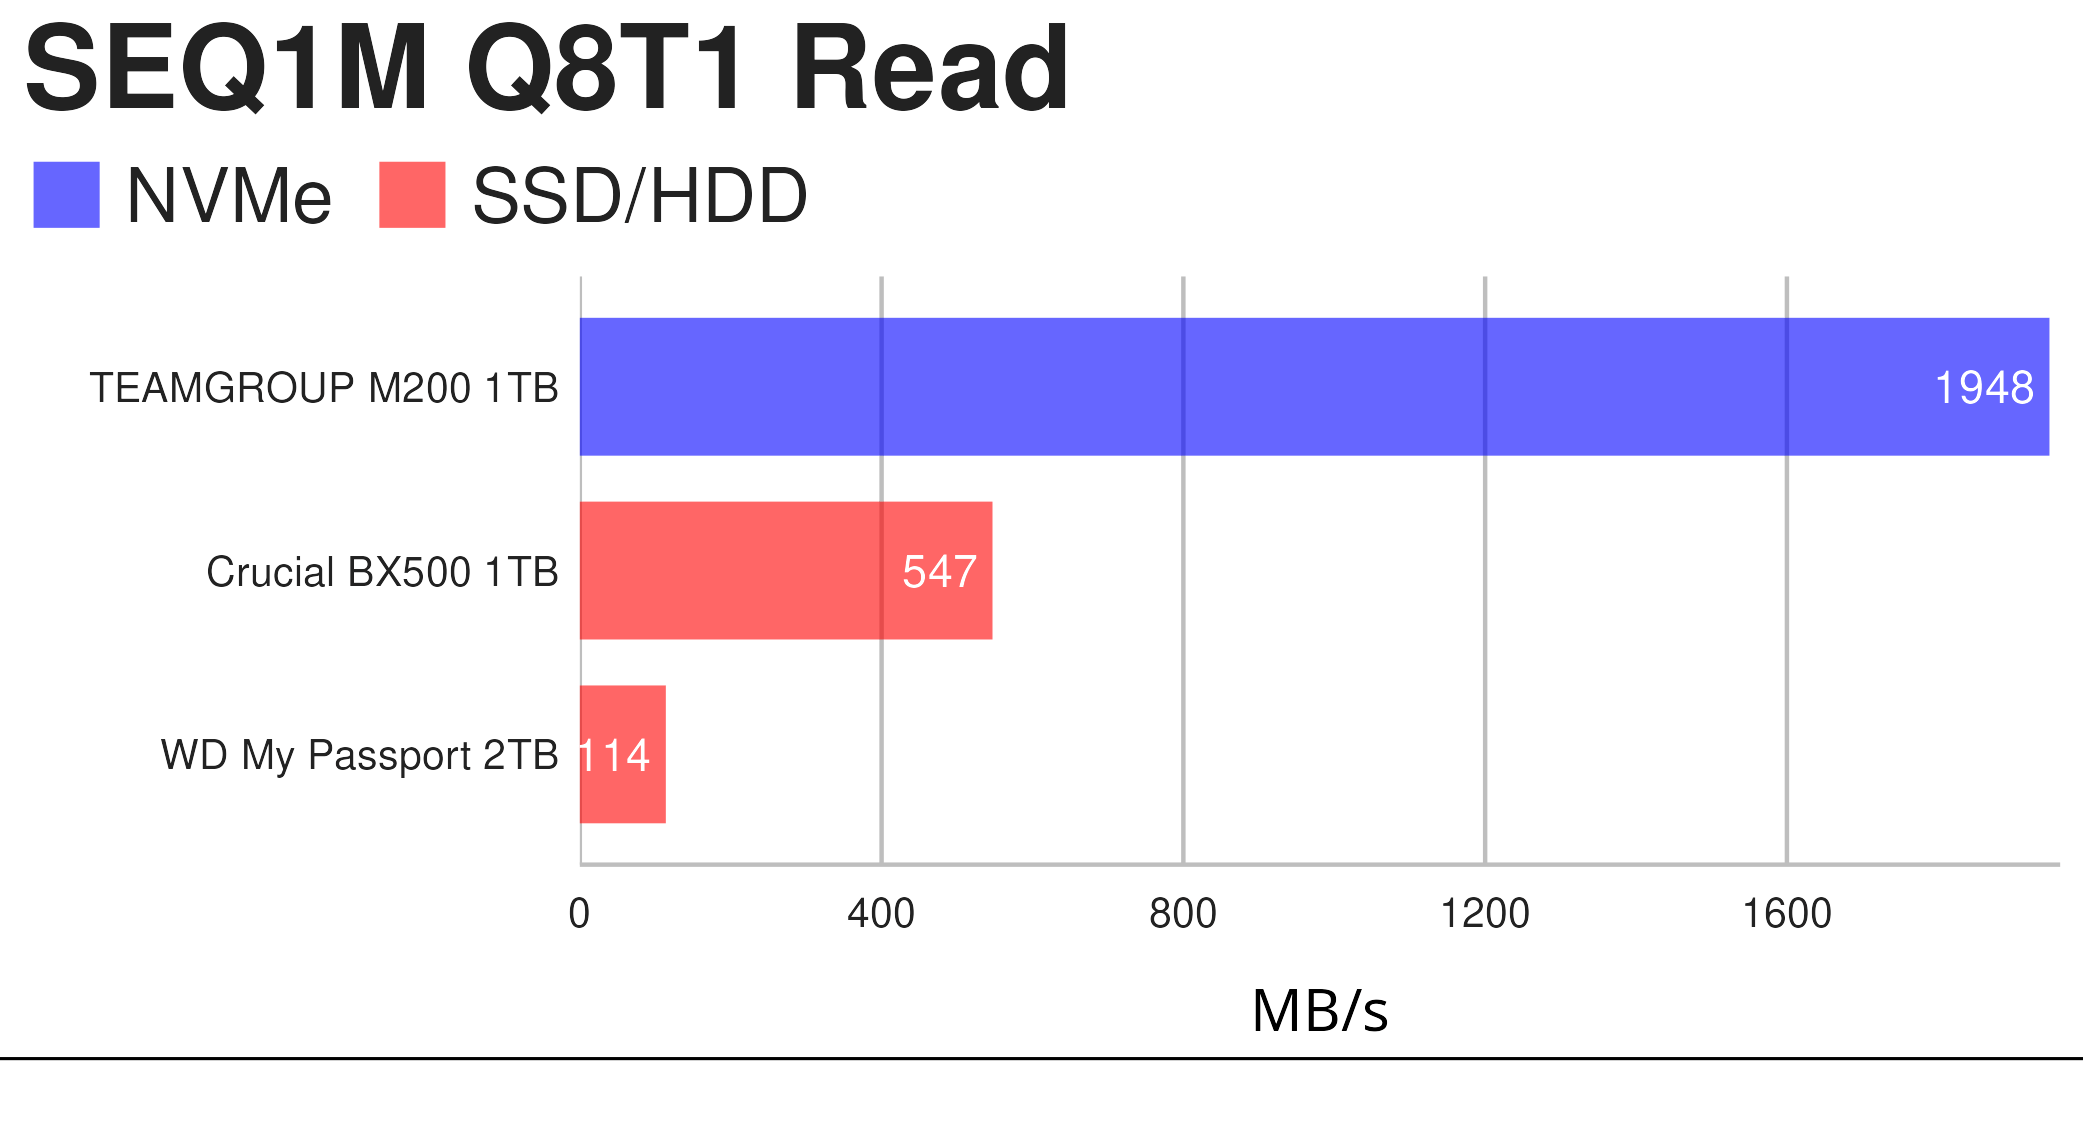
A great result for the TEAMGROUP M200 as it gets very close to its advertised maximum 2,000 MB/s read speed. This benchmark is useful for tasks such as high-resolution video editing. The Crucial SSD’s performance wasn’t impacted from being put in an USB enclosure. Unsurprisingly the WD mechanical portable disk (with a 5400 RPM rotational speed) lags well behind.
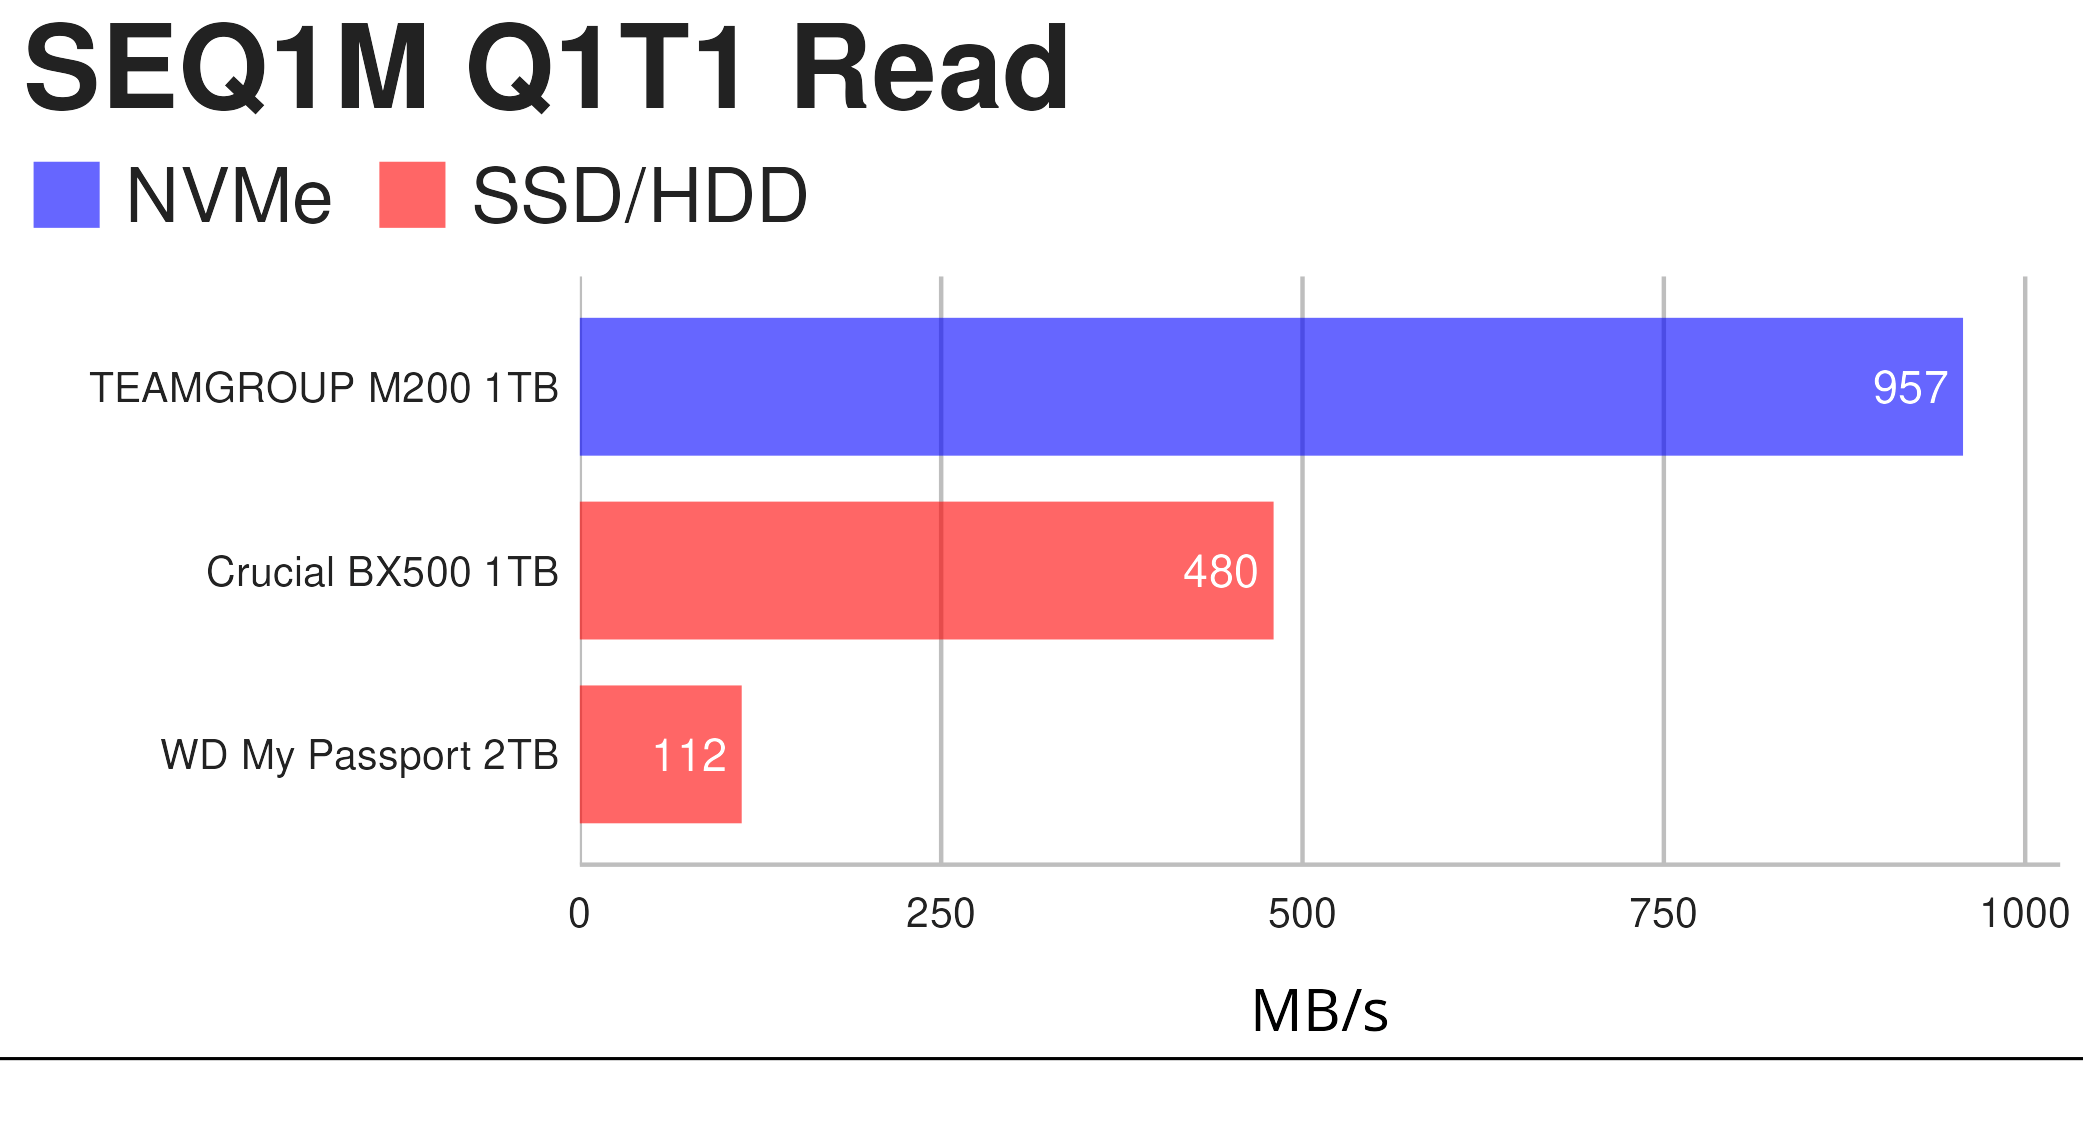
In this sequential test, the TEAMGROUP M200 again fares much better.
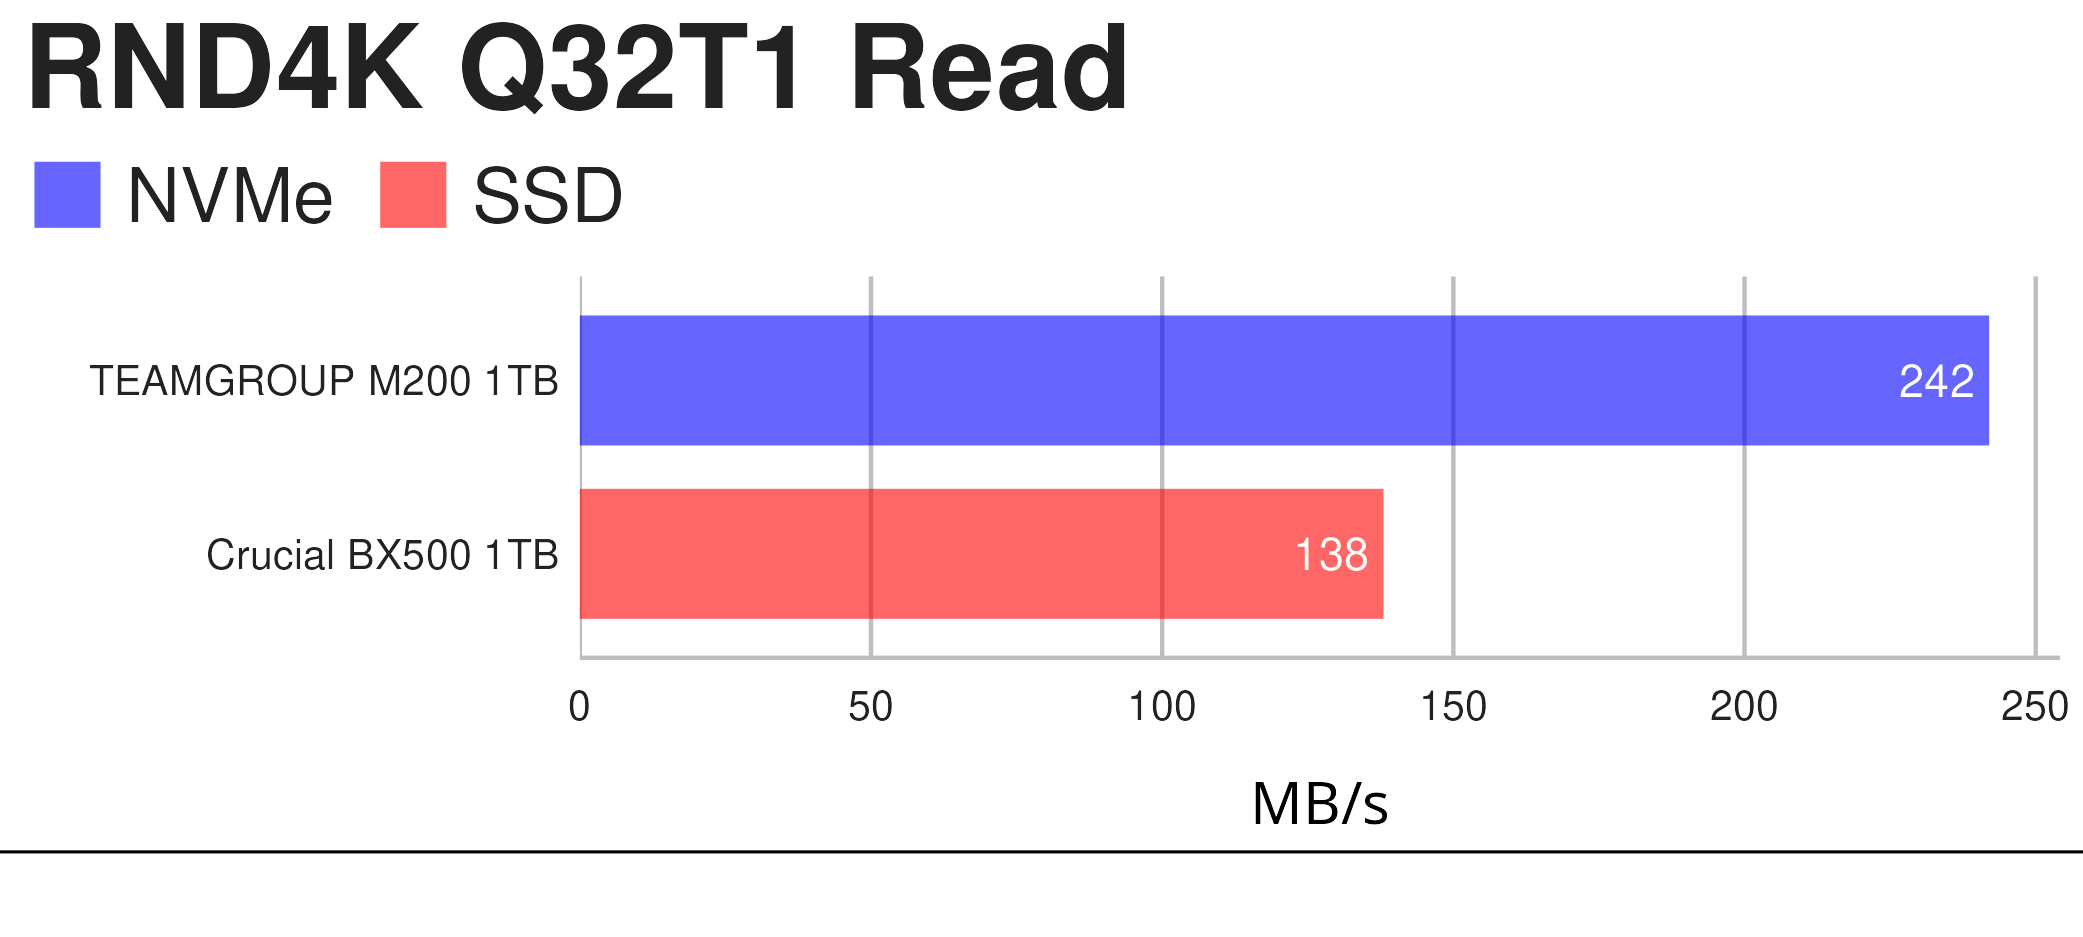
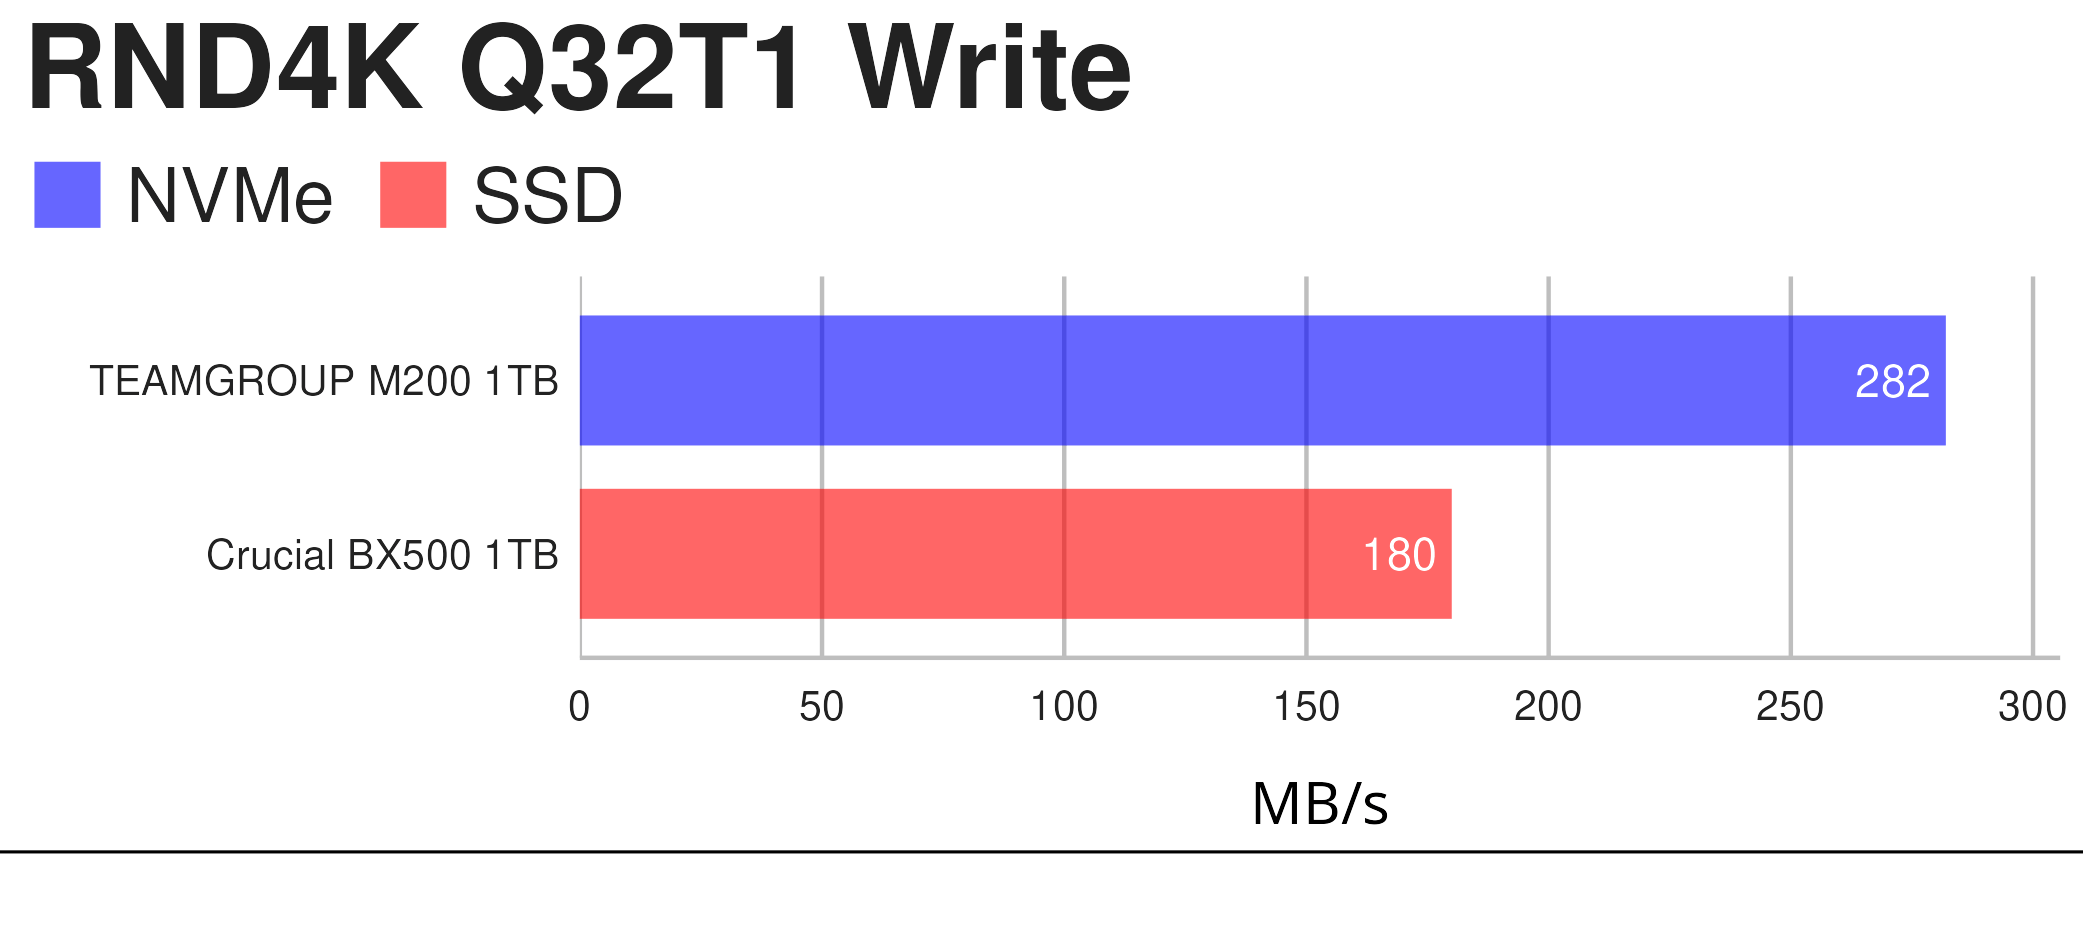
Random read and write performance is important when copying lots of small files or when the drive is used as storage for games or applications that are directly started off the drive.
We’re not showing the WD mechanical portable drive in the RND4K benchmarks, simply because as they are so low they don’t display well in the charts. Just for reference, the RND4L Q32T1 read benchmark for the WD drive is a mere 0.58 MB/s.
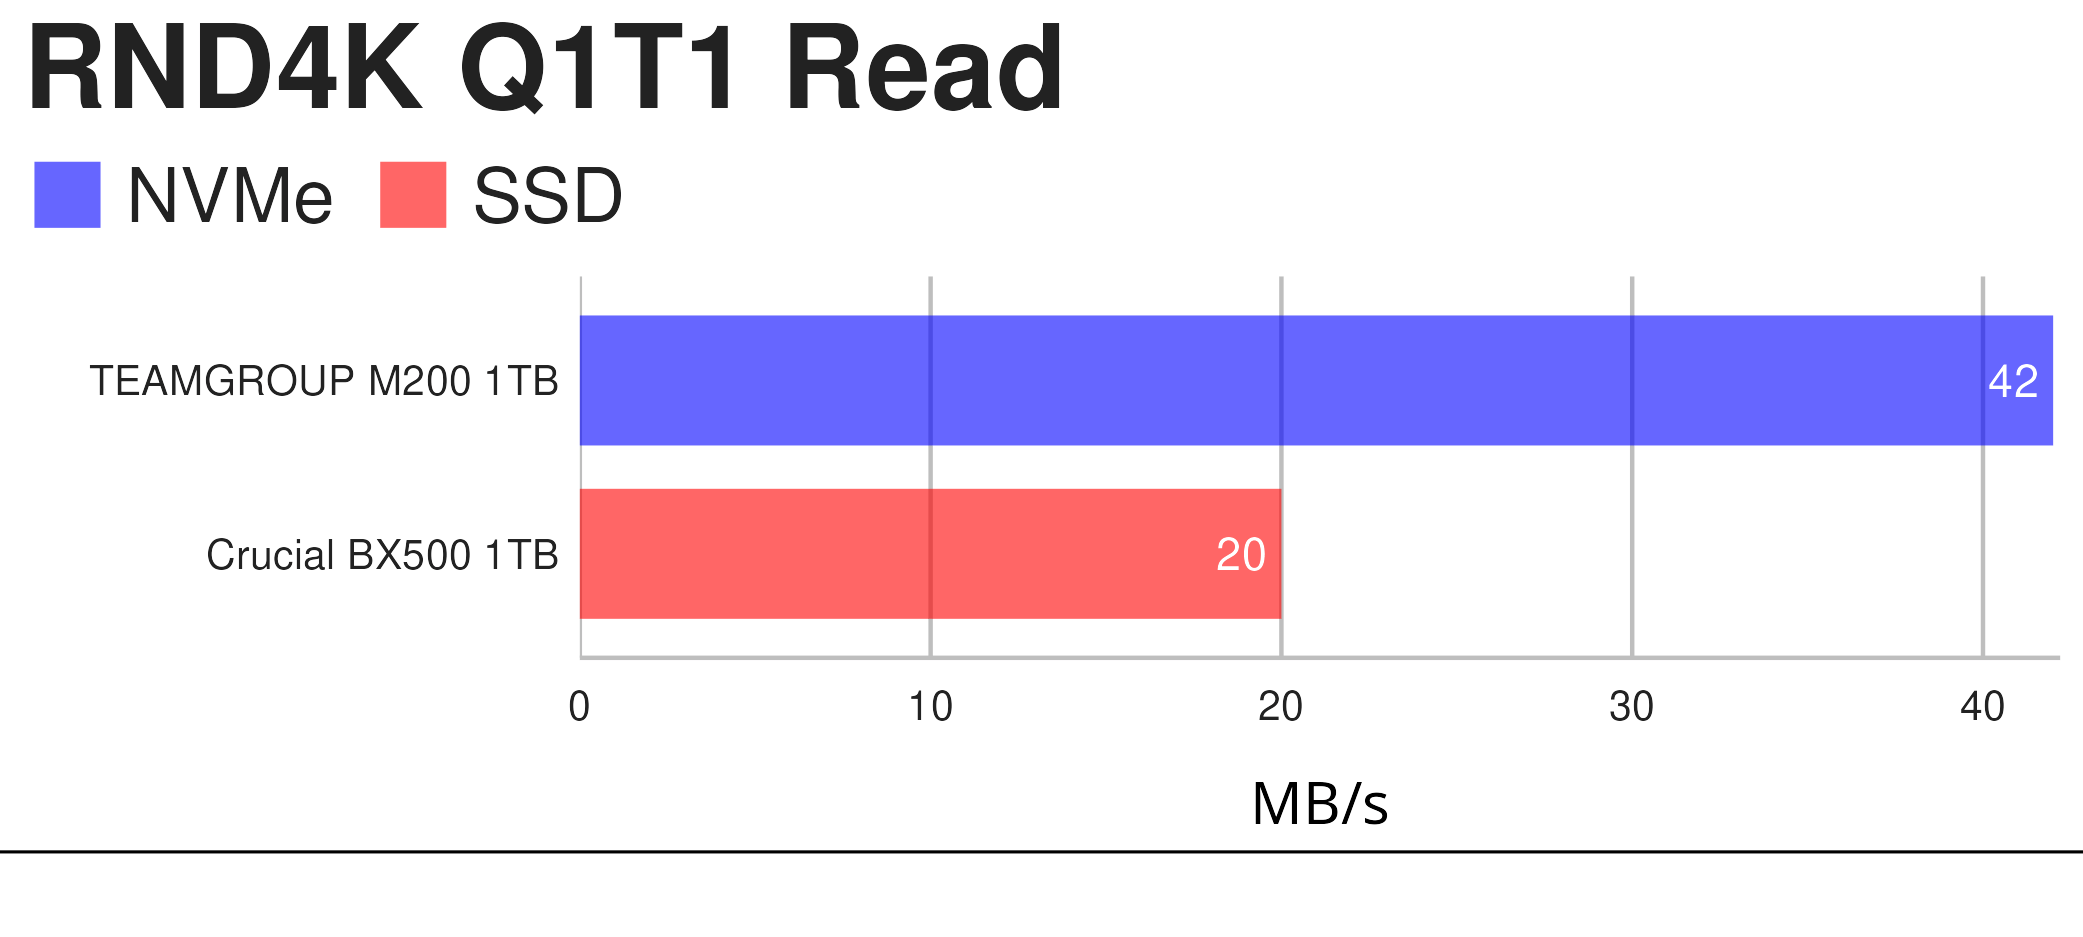
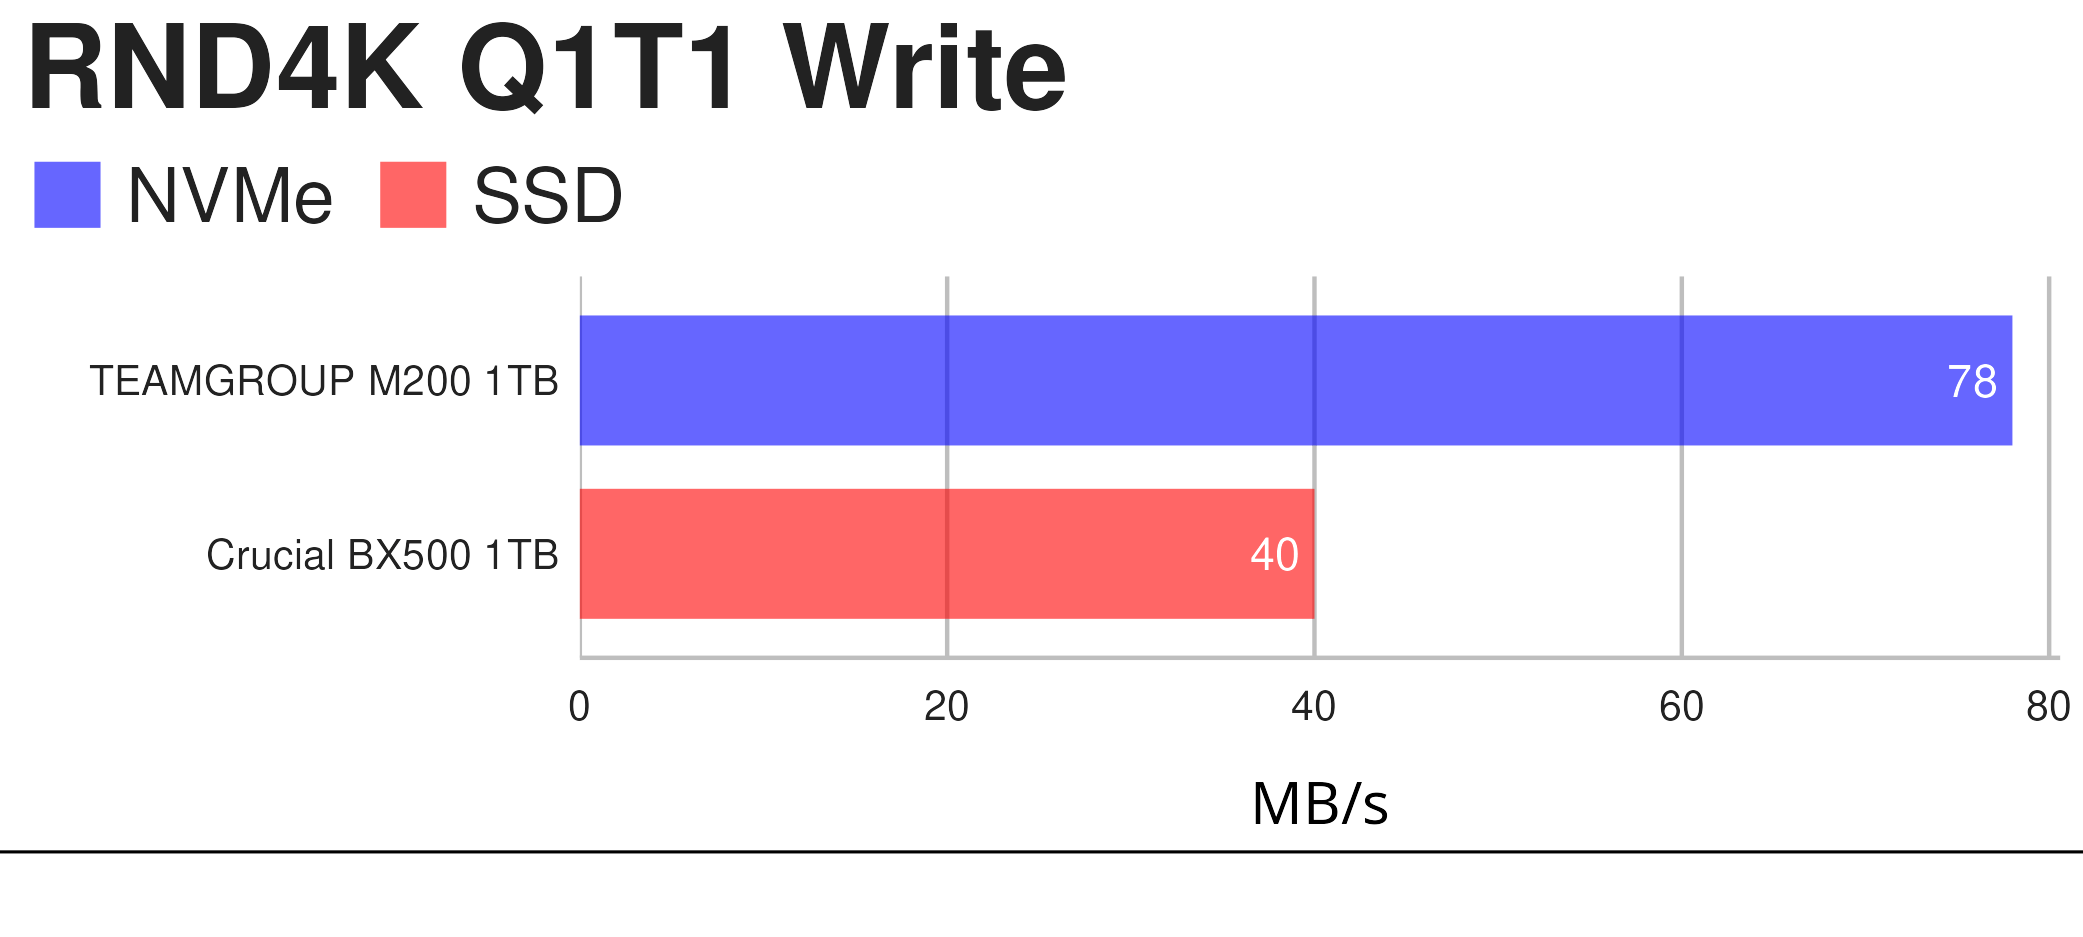
The final read test represents more straightforward and common tasks. The TEAMGROUP MP200 performs well in this test too.
Let’s turn to the write benchmarks.
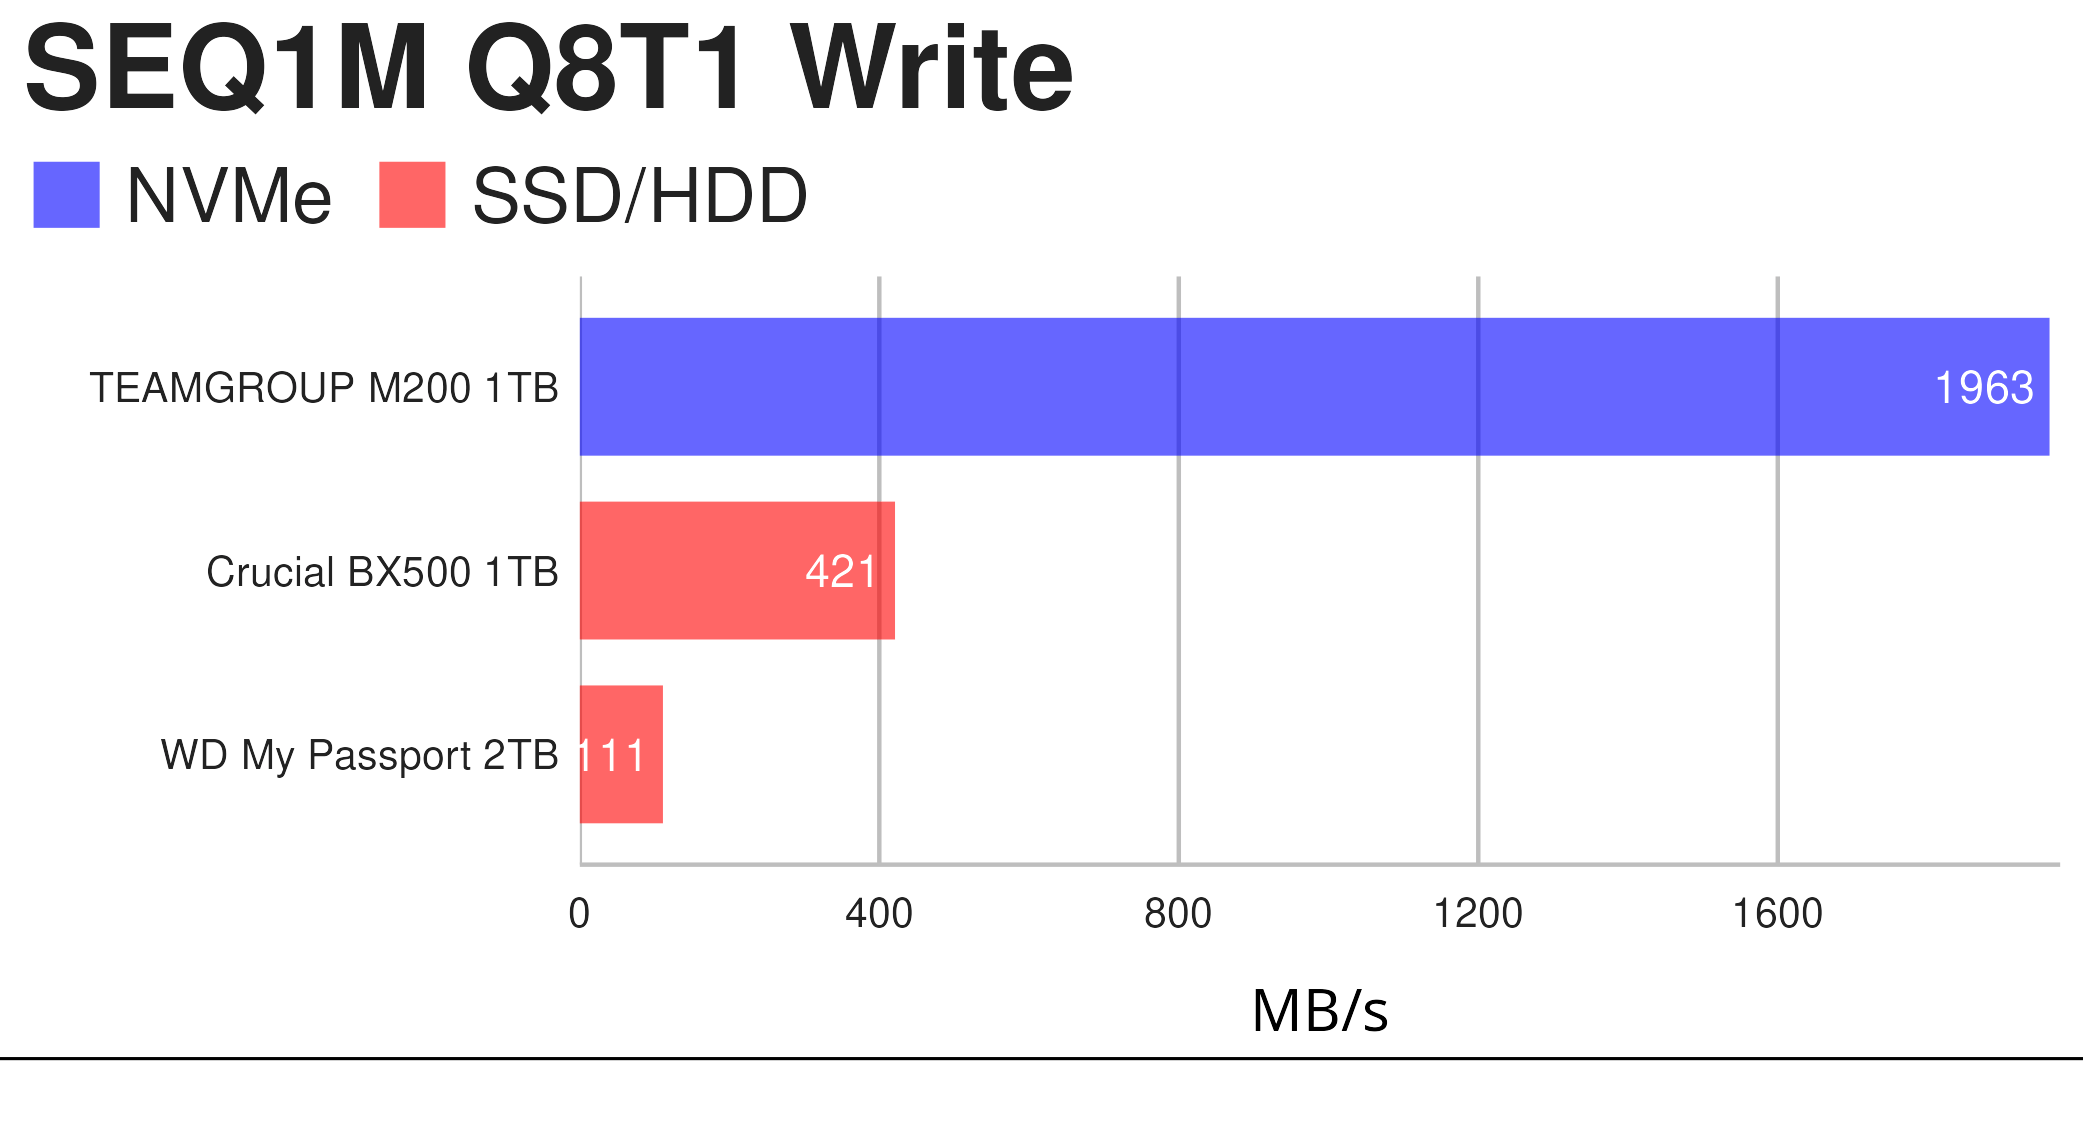
Again the MP200 gets very close to its advertised 2000 MB/s write speed.
The benchmark doesn’t accurately capture the real-world performance of the BX500 SSD. On large writes, the BX500 actually performs significantly worse than the benchmark indicates. Once the BX500 cache is used up, write speeds fall to around 50-60MB/s because of the lack of a DRAM cache, and is actually worse than the mechanical WD drive which maintains a consistent (but still slow) write speed on large writes.
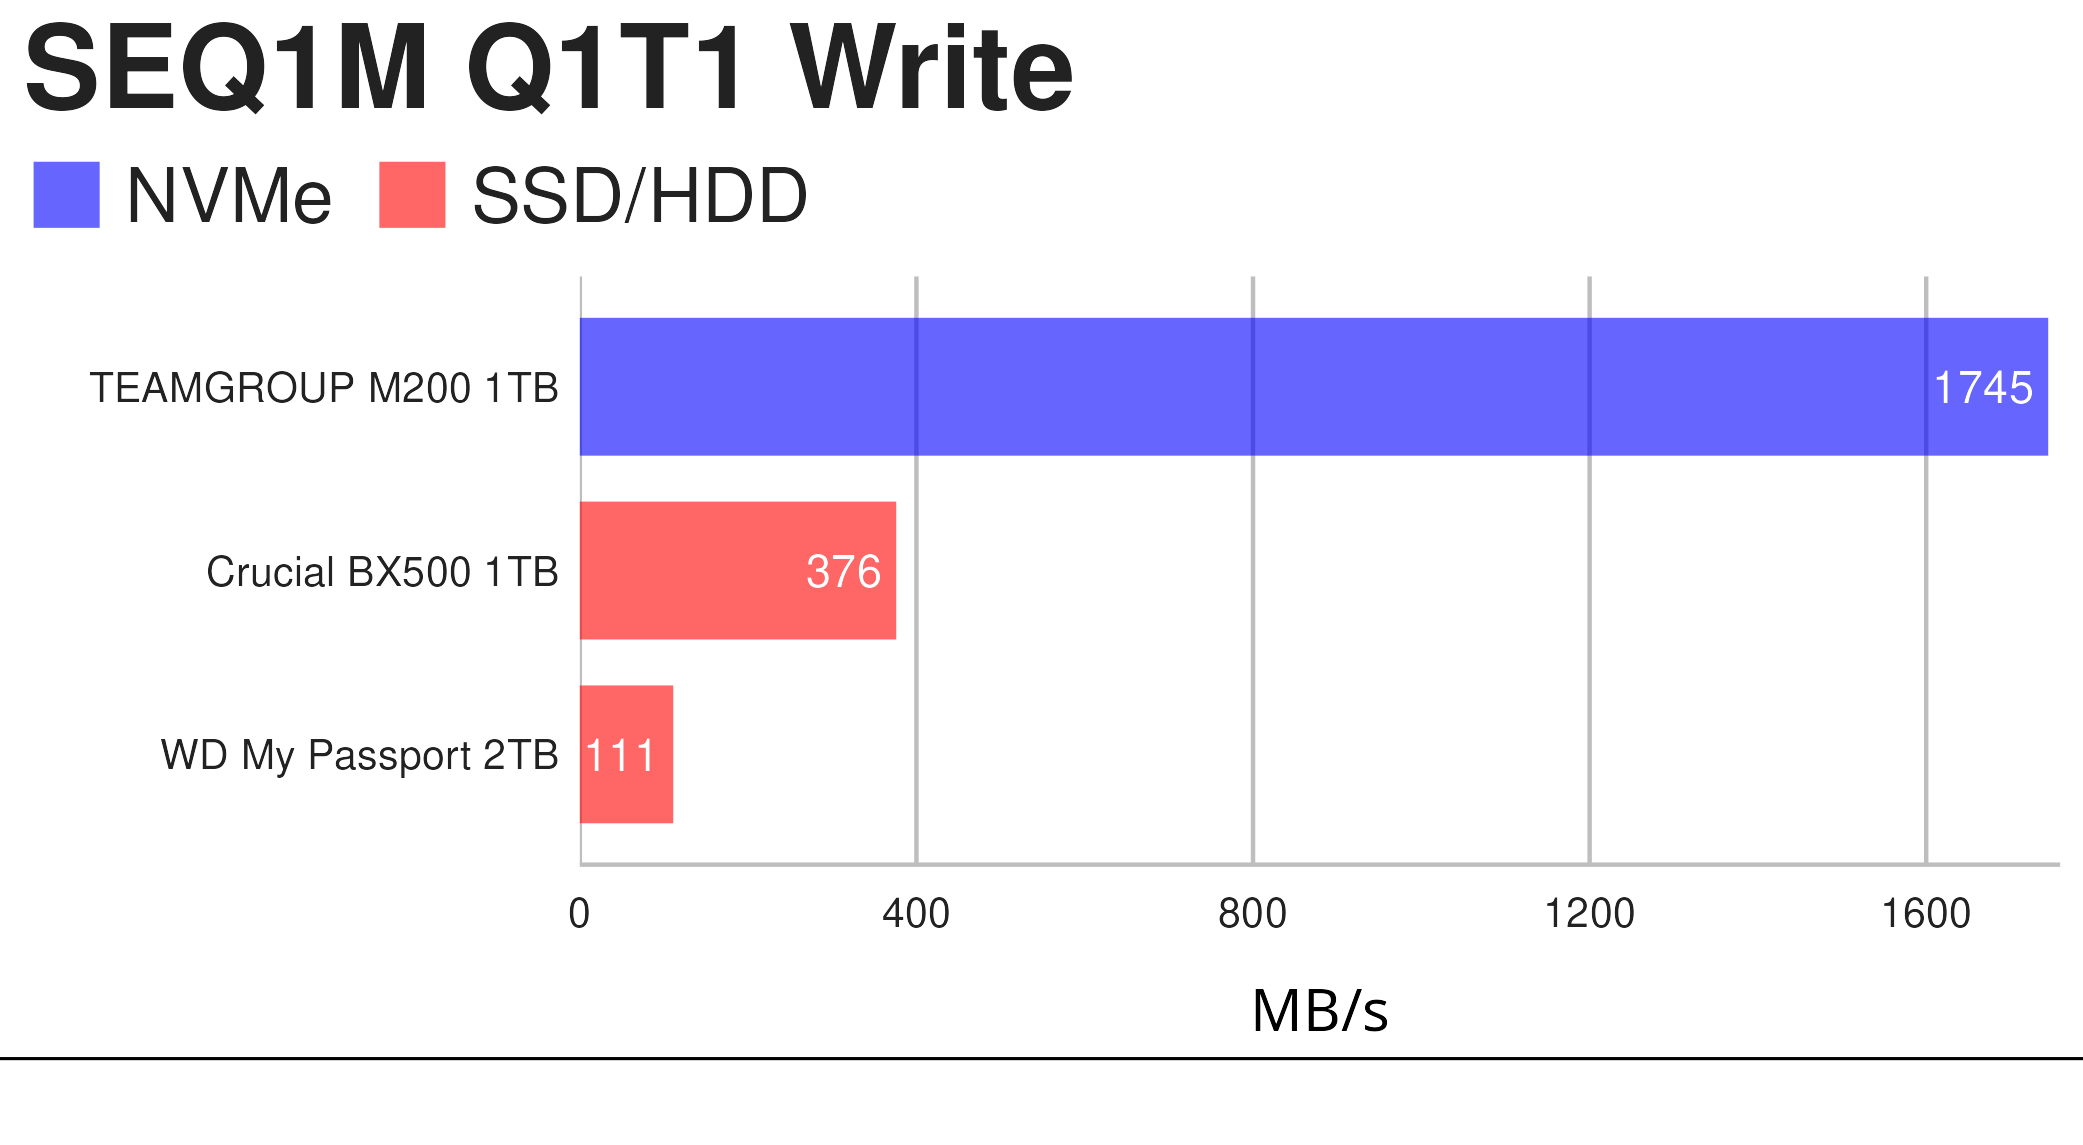
Again, the benchmark for the BX500 appears to give a reasonable performance. But write speed (once the cache is used up) is appalling on the Crucial drive.
Official write specifications are only part of the performance picture. Most SSDs implement a write cache, which is a fast area of (usually) pseudo-SLC programmed flash that absorbs incoming data. The write saturation results for the Crucial are poor for its price point. The TEAMGROUP NVMe write speed also drops once off cache but performance is far less impacted compared to the Crucial drive. That’s consistent with the fact that NVMe doesn’t necessarily need DRAM with the right controller.
Pages in this article:
Page 1 – Introduction and Specifications
Page 2 – Benchmarks
Page 3 – Summary
Does the NUC have USB 3.2 Gen2x2 ports?
The USB standards are confusing for many people, mainly because the current USB 3.2 branding also encompasses the older USB 3.0 standard to create a total of three varieties of USB 3.2.
The three common versions of USB 3.2 are:
USB 3.2 Gen 2×2 (originally USB 3.2) which is called SuperSpeed USB 20Gbps and has a maximum speed of 20Gbps
USB 3.2 Gen 2 (originally USB 3.1) which is called SuperSpeed USB 10Gbps and has a maximum speed of 10Gbps
USB 3.2 Gen 1 (originally USB 3.0) which is called SuperSpeed USB and has a maximum speed of 5Gbps.
The NUC has 3 USB 3.2 Gen 2 ports and two USB 4 (Thunderbolt ports). These ports (including the Thunderbolt ports) give a maximum speed of 10 Gbps with the M200 SSD not the 20 Gbps that this SSD delivers with USB 3.2 Gen 2×2.
I see, interesting.
How do I know what type of ports i’ve got on my computer?
It’s best to check your specific motherboard’s manual.
And bear in mind if you have a USB 3.2 cable that can say only handle 5Gbps, you’ll only get up to 5Gbps even if you have USB 3.2 Gen 2×2 port(s).
The larger storage sizes look really useful.
Can USB-4 give the 20 Gbps that this SSD offers?
With some devices it can, with other devices (such as the NUC) it doesn’t.