Last Updated on March 24, 2022
In Operation
Let’s highlight the features of tickrs with some images of the software in action.
We can specify multiple ticker symbols from the command-line. For the images below, we started the program with the command:
tickrs -s JPM,PFE,IBM,GOOG,AZN.L,COST,DOCU,INTC,BDX,BLK
At the top are tabs for the 10 stock tickers we chose. Below the tabs are single key press toggles.
We’re showing a chart for Pfizer stock over a current day. There’s the facility to change the charting period from 1 day up to 5 years with the list at the bottom.
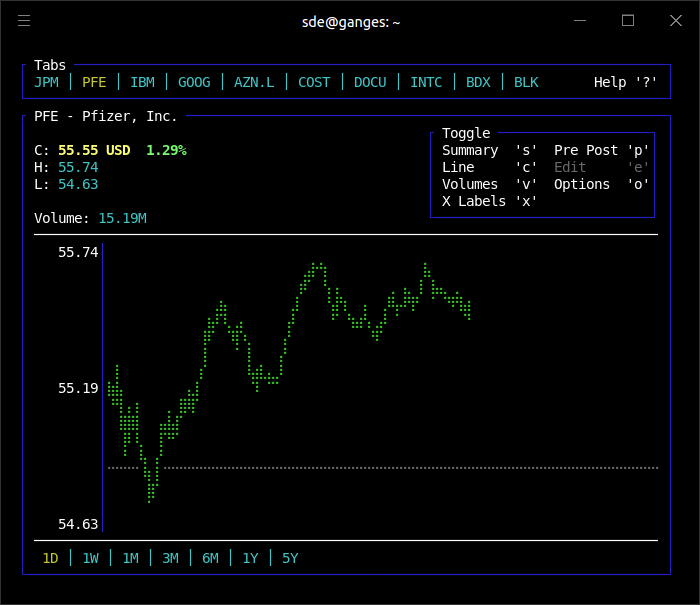
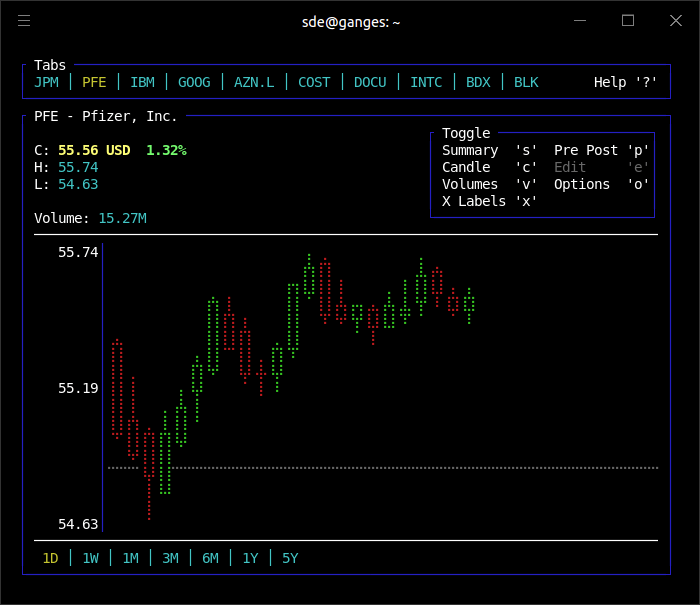
By default, the program shows a line chart. Press c to change to a candlestick chart. This type of chart is used by traders to determine possible price movement based on past patterns.
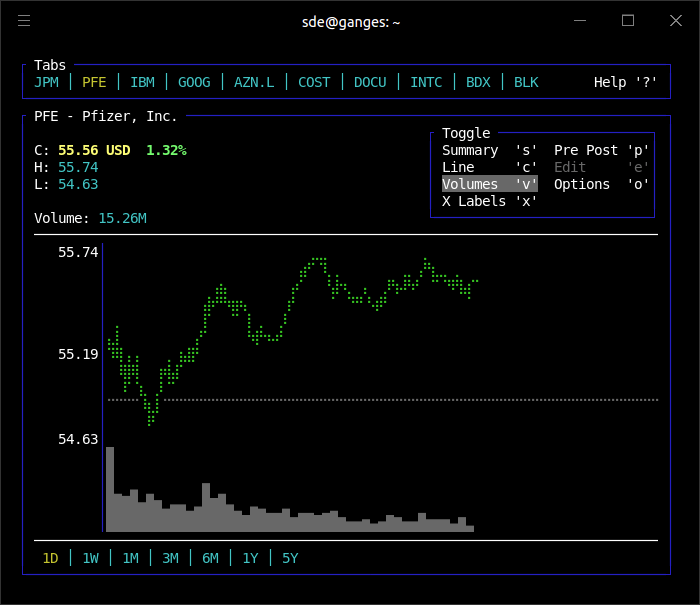
We can also see the trading volumes for a specific stock by pressing the v key. The image below shows the trading volume for Pfizer, Inc.
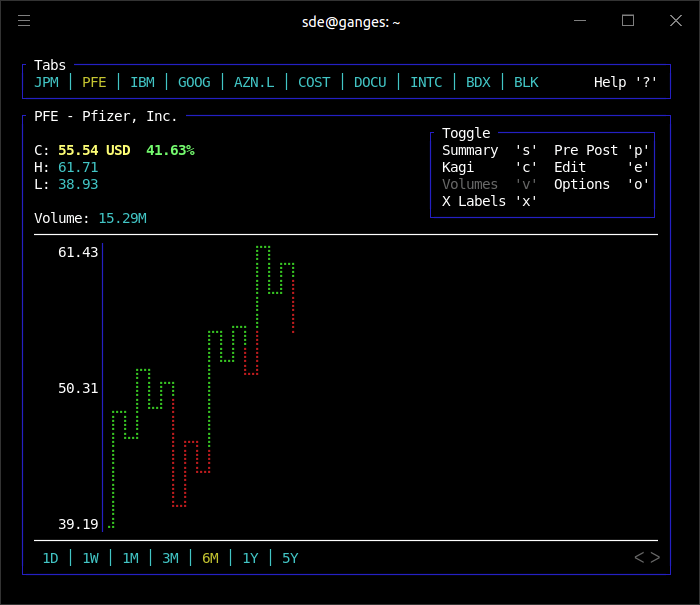
The software also supports Kagi charts. The Kagi chart is a specialized type of technical analysis that uses a series of vertical lines to illustrate general levels of supply and demand. Kagi charts change direction when there is a price reversal of a specified amount, or more. This type of chart, having no regard for time, offers the advantage of reducing noise. Noise is a particular drawback of traditional candlestick charting methods.
You’ll notice that none of the charts above display time on the X axis. This functionality is available by pressing the x key.
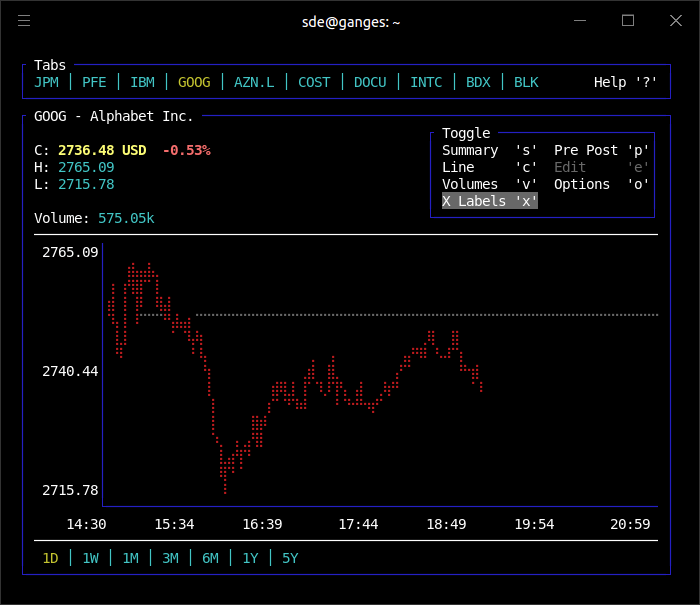
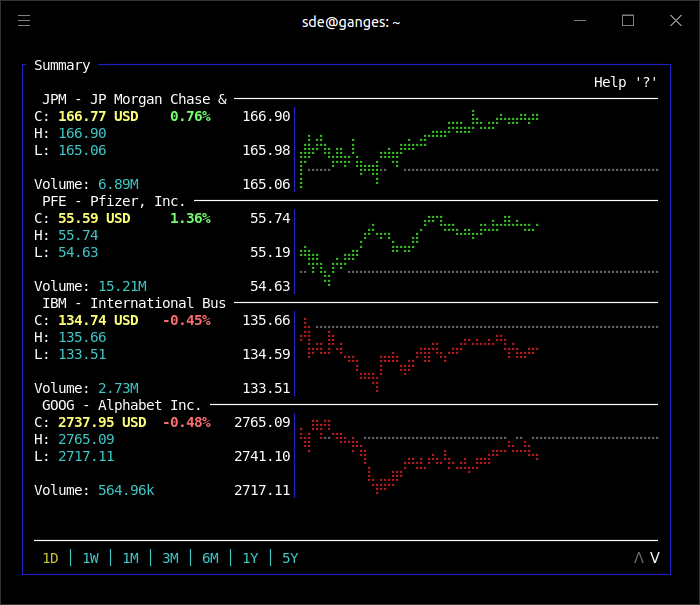
The summary screen is particularly useful as it lets us monitor multiple stocks simultaneously, rather than traversing through the tabs. In the image below we’re monitoring 4 stocks. We’ve restricted the number simply to make the image a reasonable size.
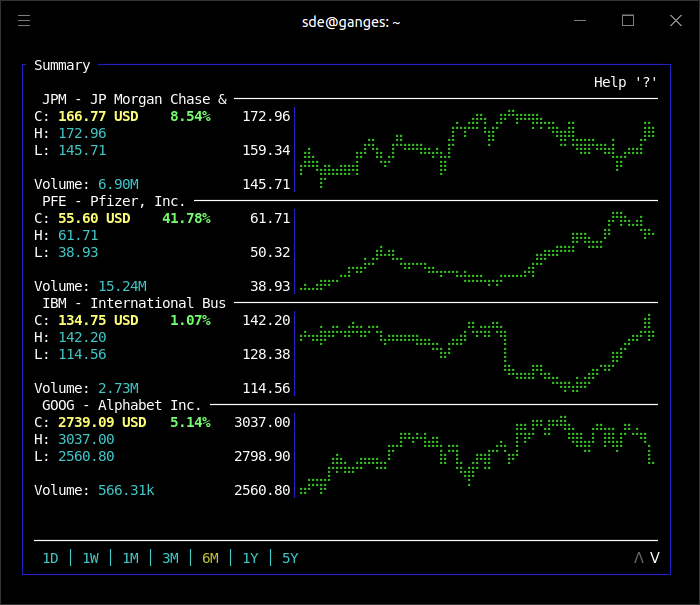
Here’s another summary chart, this time we’re showing the stock movements over the past 6 months.
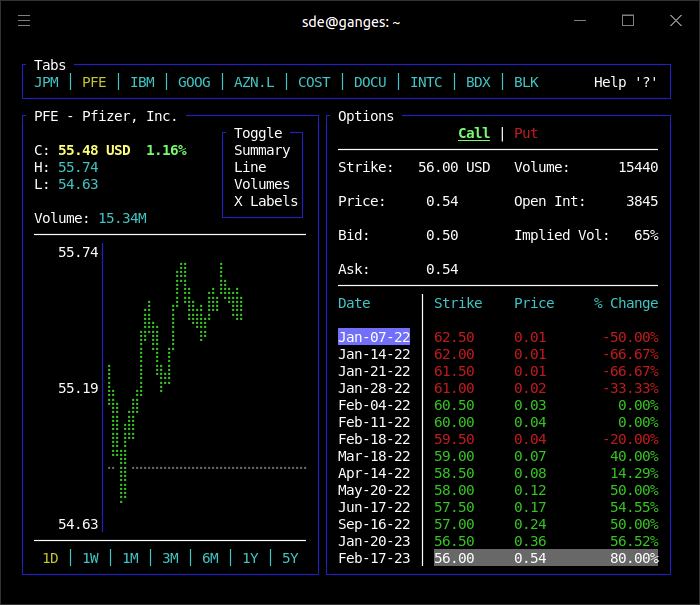
There’s also support for options.
Pages in this article:
Page 1 – Introduction / Installation
Page 2 – In Operation
Page 3 – Summary

tickrs is very good