In Operation
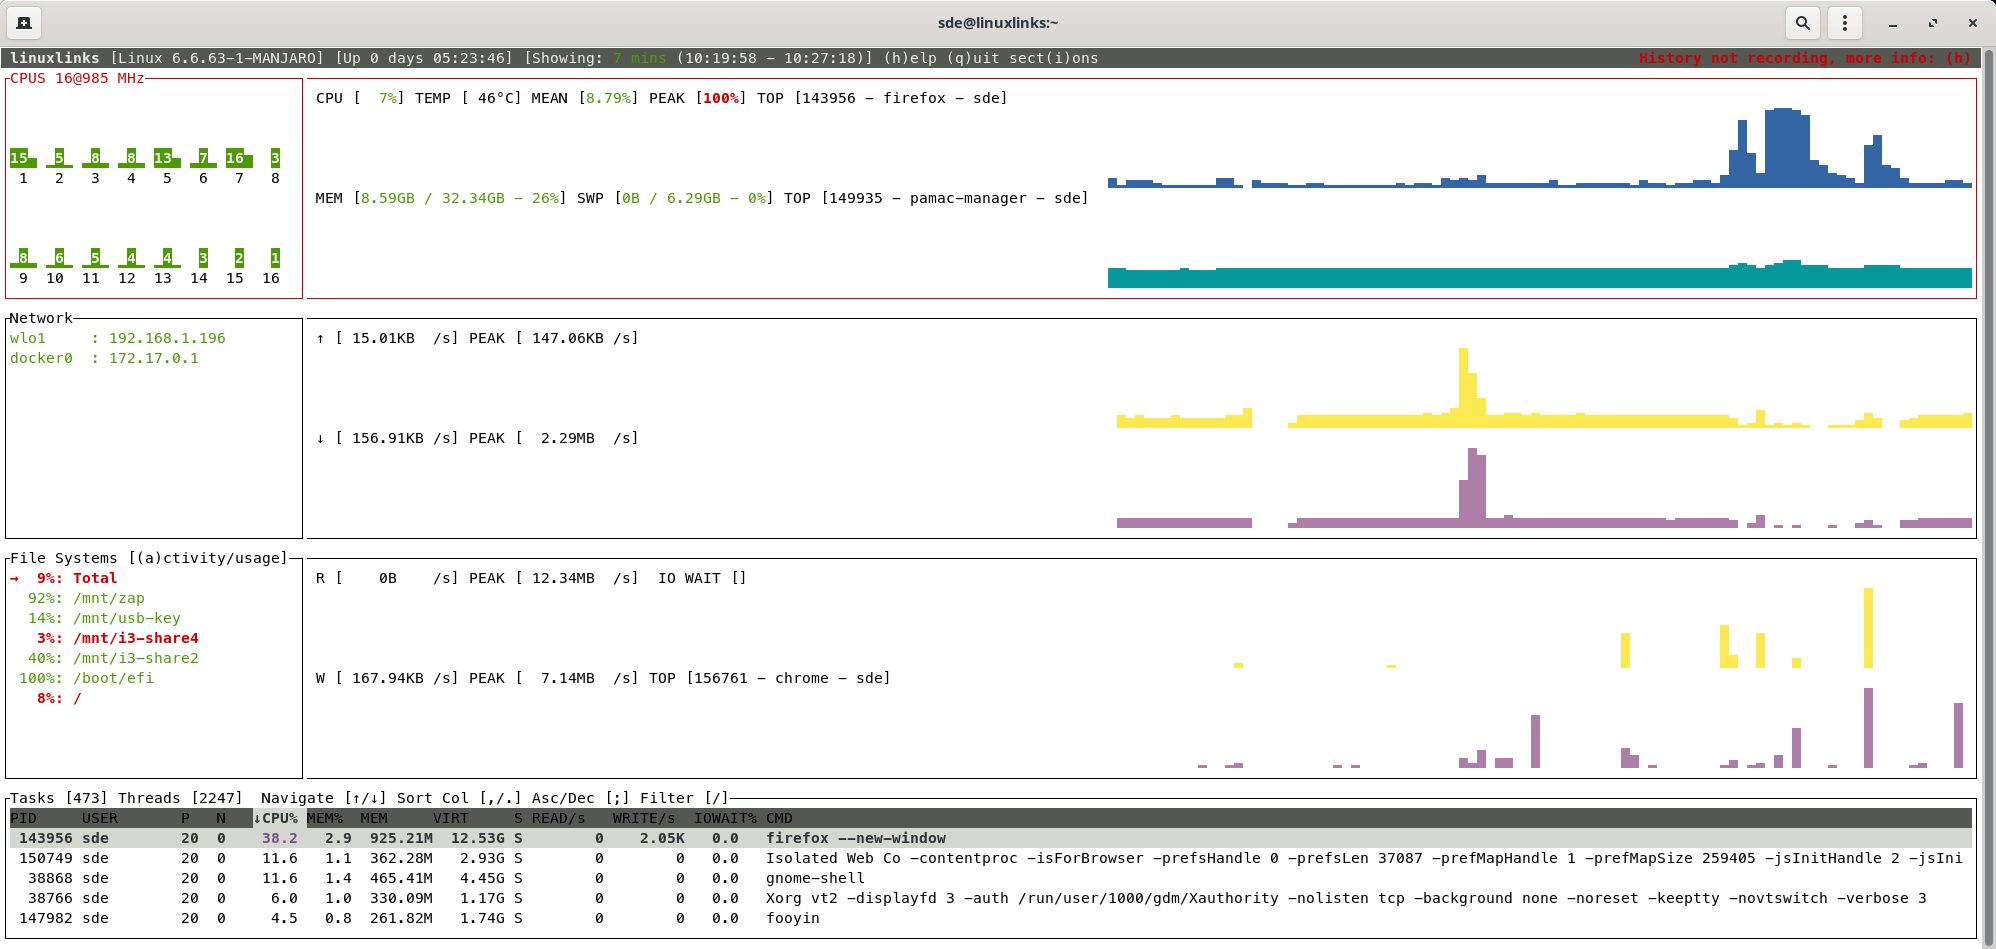
Here’s an image of Zenith in operation. We normally use the hyper terminal emulator to showcase terminal-based software. But a few entries are hard to read with our default hyper colours, so we switched to a different terminal emulator for the image below. It would be helpful if Zenith let us change the colours it uses.

The top section shows usage for CPU and memory. As the image shows, Zenith reports the machine has 16 cores. The CPU actually has 4 P-cores (with hyperhreading) and 8 E-cores, but like other top-like utility threads are reported as cores. We’d love to see an option for the CPU% on the left hand side stacked vertically.
The software is configurable. By default CPU, memory, network and disk usage charts are reported, but their output can be disabled. Each system panel (CPU, network, file systems etc) can also be resized. We also like that the chart views can be zoomed in and we can scroll back in time.
The file system section shows that we’re running short of disk space on our local disk as well as a network disk. These two are shown in red. We really need bigger disks.
There’s a top-like filterable process table that includes per process disk usage, and the ability to change the process priority.
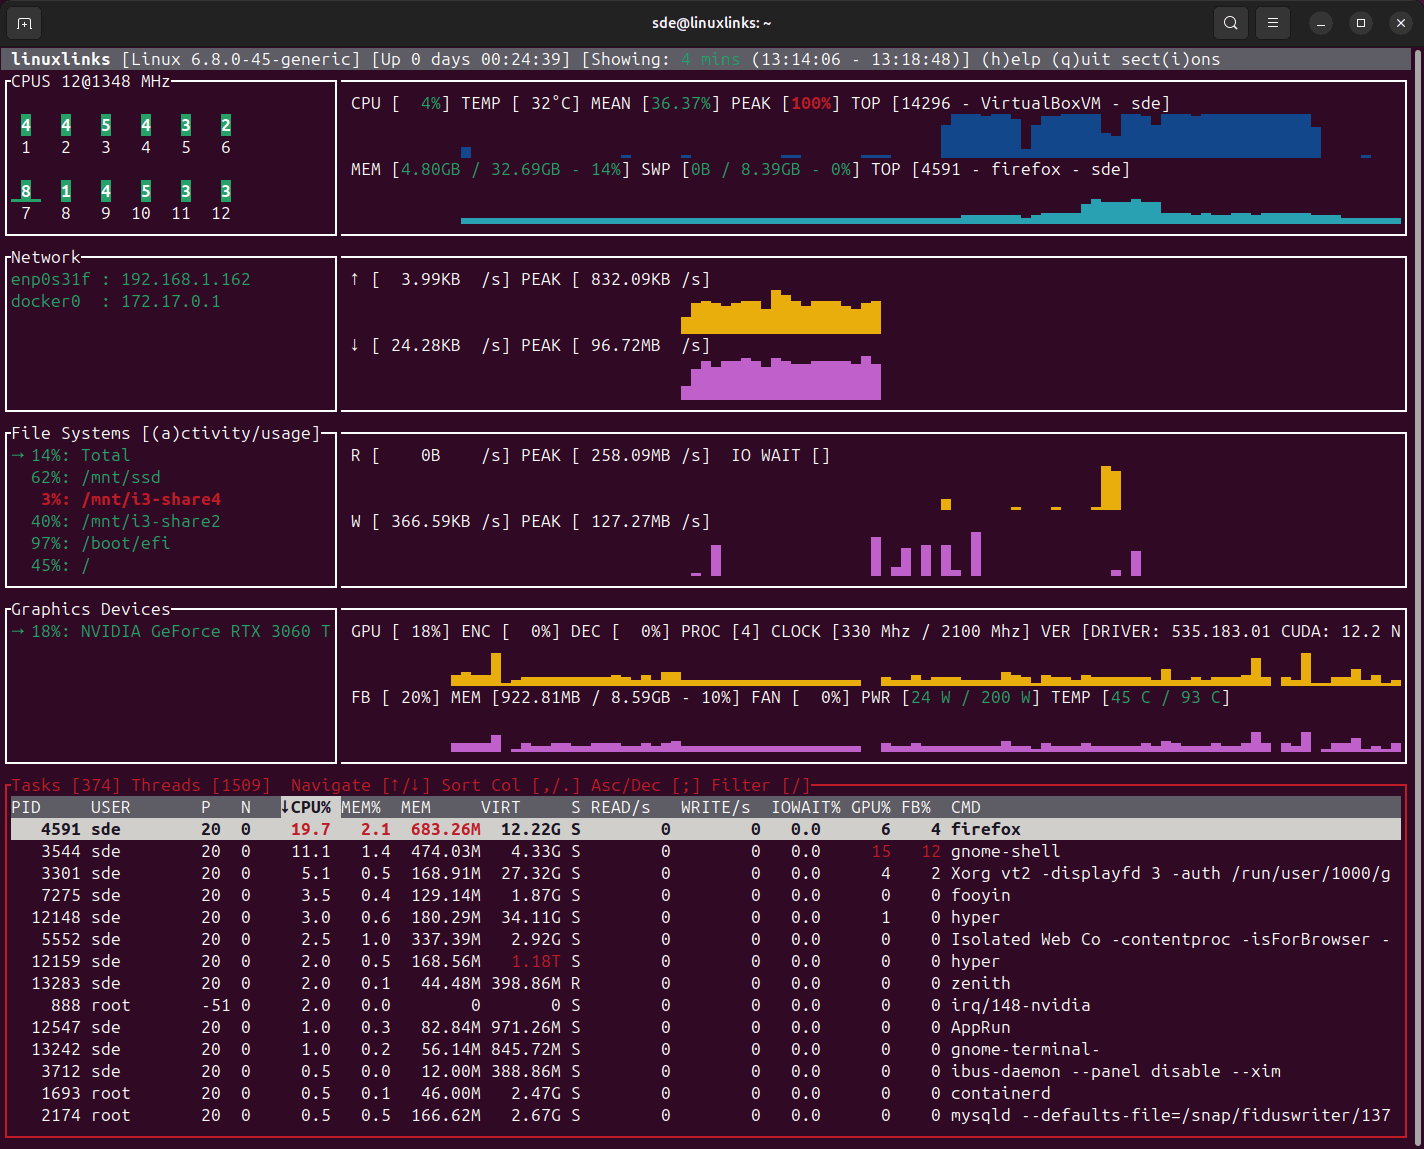
The machine has an Intel GPU. Zenith doesn’t support showing GPU information for Intel GPUs. That’s also the case for AMD GPUs. But the software can display GPU utilization metrics for NVIDIA cards.
Here’s Zenith in action this time on a machine which has a dedicated NVIDIA card.

The software can also show battery percentage, time to charge or discharge, and power used but this information isn’t showing in either image as both machines are not laptops.
What else does the software offer?
- Managing processes with signals.
- Performance data saved between runs.
- And if the software is run with root permissions, there’s support for delay accounting. This is where tasks encounter delays in execution when they wait for some kernel resource to become available.
Summary
Zenith is a very handy utility for monitoring your system. You can customize what information is displayed. And the zoomable chart views combined with the ability to scroll back in time makes for a much more powerful top-like utility.
Zenith faces stiff competition from similar open source software such as btop++, Glances, bottom, and many others explored in this roundup. But the project has lots of interesting features planned such as sensor temperature charts, ZFS, and GPU utilization metrics for AMD GPUs.
At the time of writing, Zenith has attracted over 2.7K GitHub stars.
Website: github.com/bvaisvil/zenith
Support:
Developer: Benjamin Vaisvil
License: MIT License
Zenith is written in Rust. Learn Rust with our recommended free books and free tutorials
Pages in this article:
Page 1 – Introduction and Installation
Page 2 – In Operation and Summary

Another program written in Rust. Why is Rust so popular?