The top utility will need little introduction to seasoned Linux users. top is a small utility that offers a dynamic real-time view of a running system.
It allows users to monitor the processes that are running on a system. top has two main sections, with the first showing general system information such as the amount of time the system has been up, load averages, the number of running and sleeping tasks, as well as information on memory and swap usage.
The second main section displays an ordered list of processes and their process ID number, the user who owns the process, the amount of resources the process is consuming (processor and memory), as well as the running time of that process.
Some versions of top offer extensive customization of the display, such as choice of columns or sorting method.
 top is a very popular utility. It helps with system administration by identifying users and processes that are hogging the system. It is also useful for non-system administrators, helping to track and kill errant processes.
However, top is showing its age and there are a bunch of utilities that offer a more feature-laden alternative. The purpose of this article is to identify alternatives to top that offer more control in managing processes on a running system.
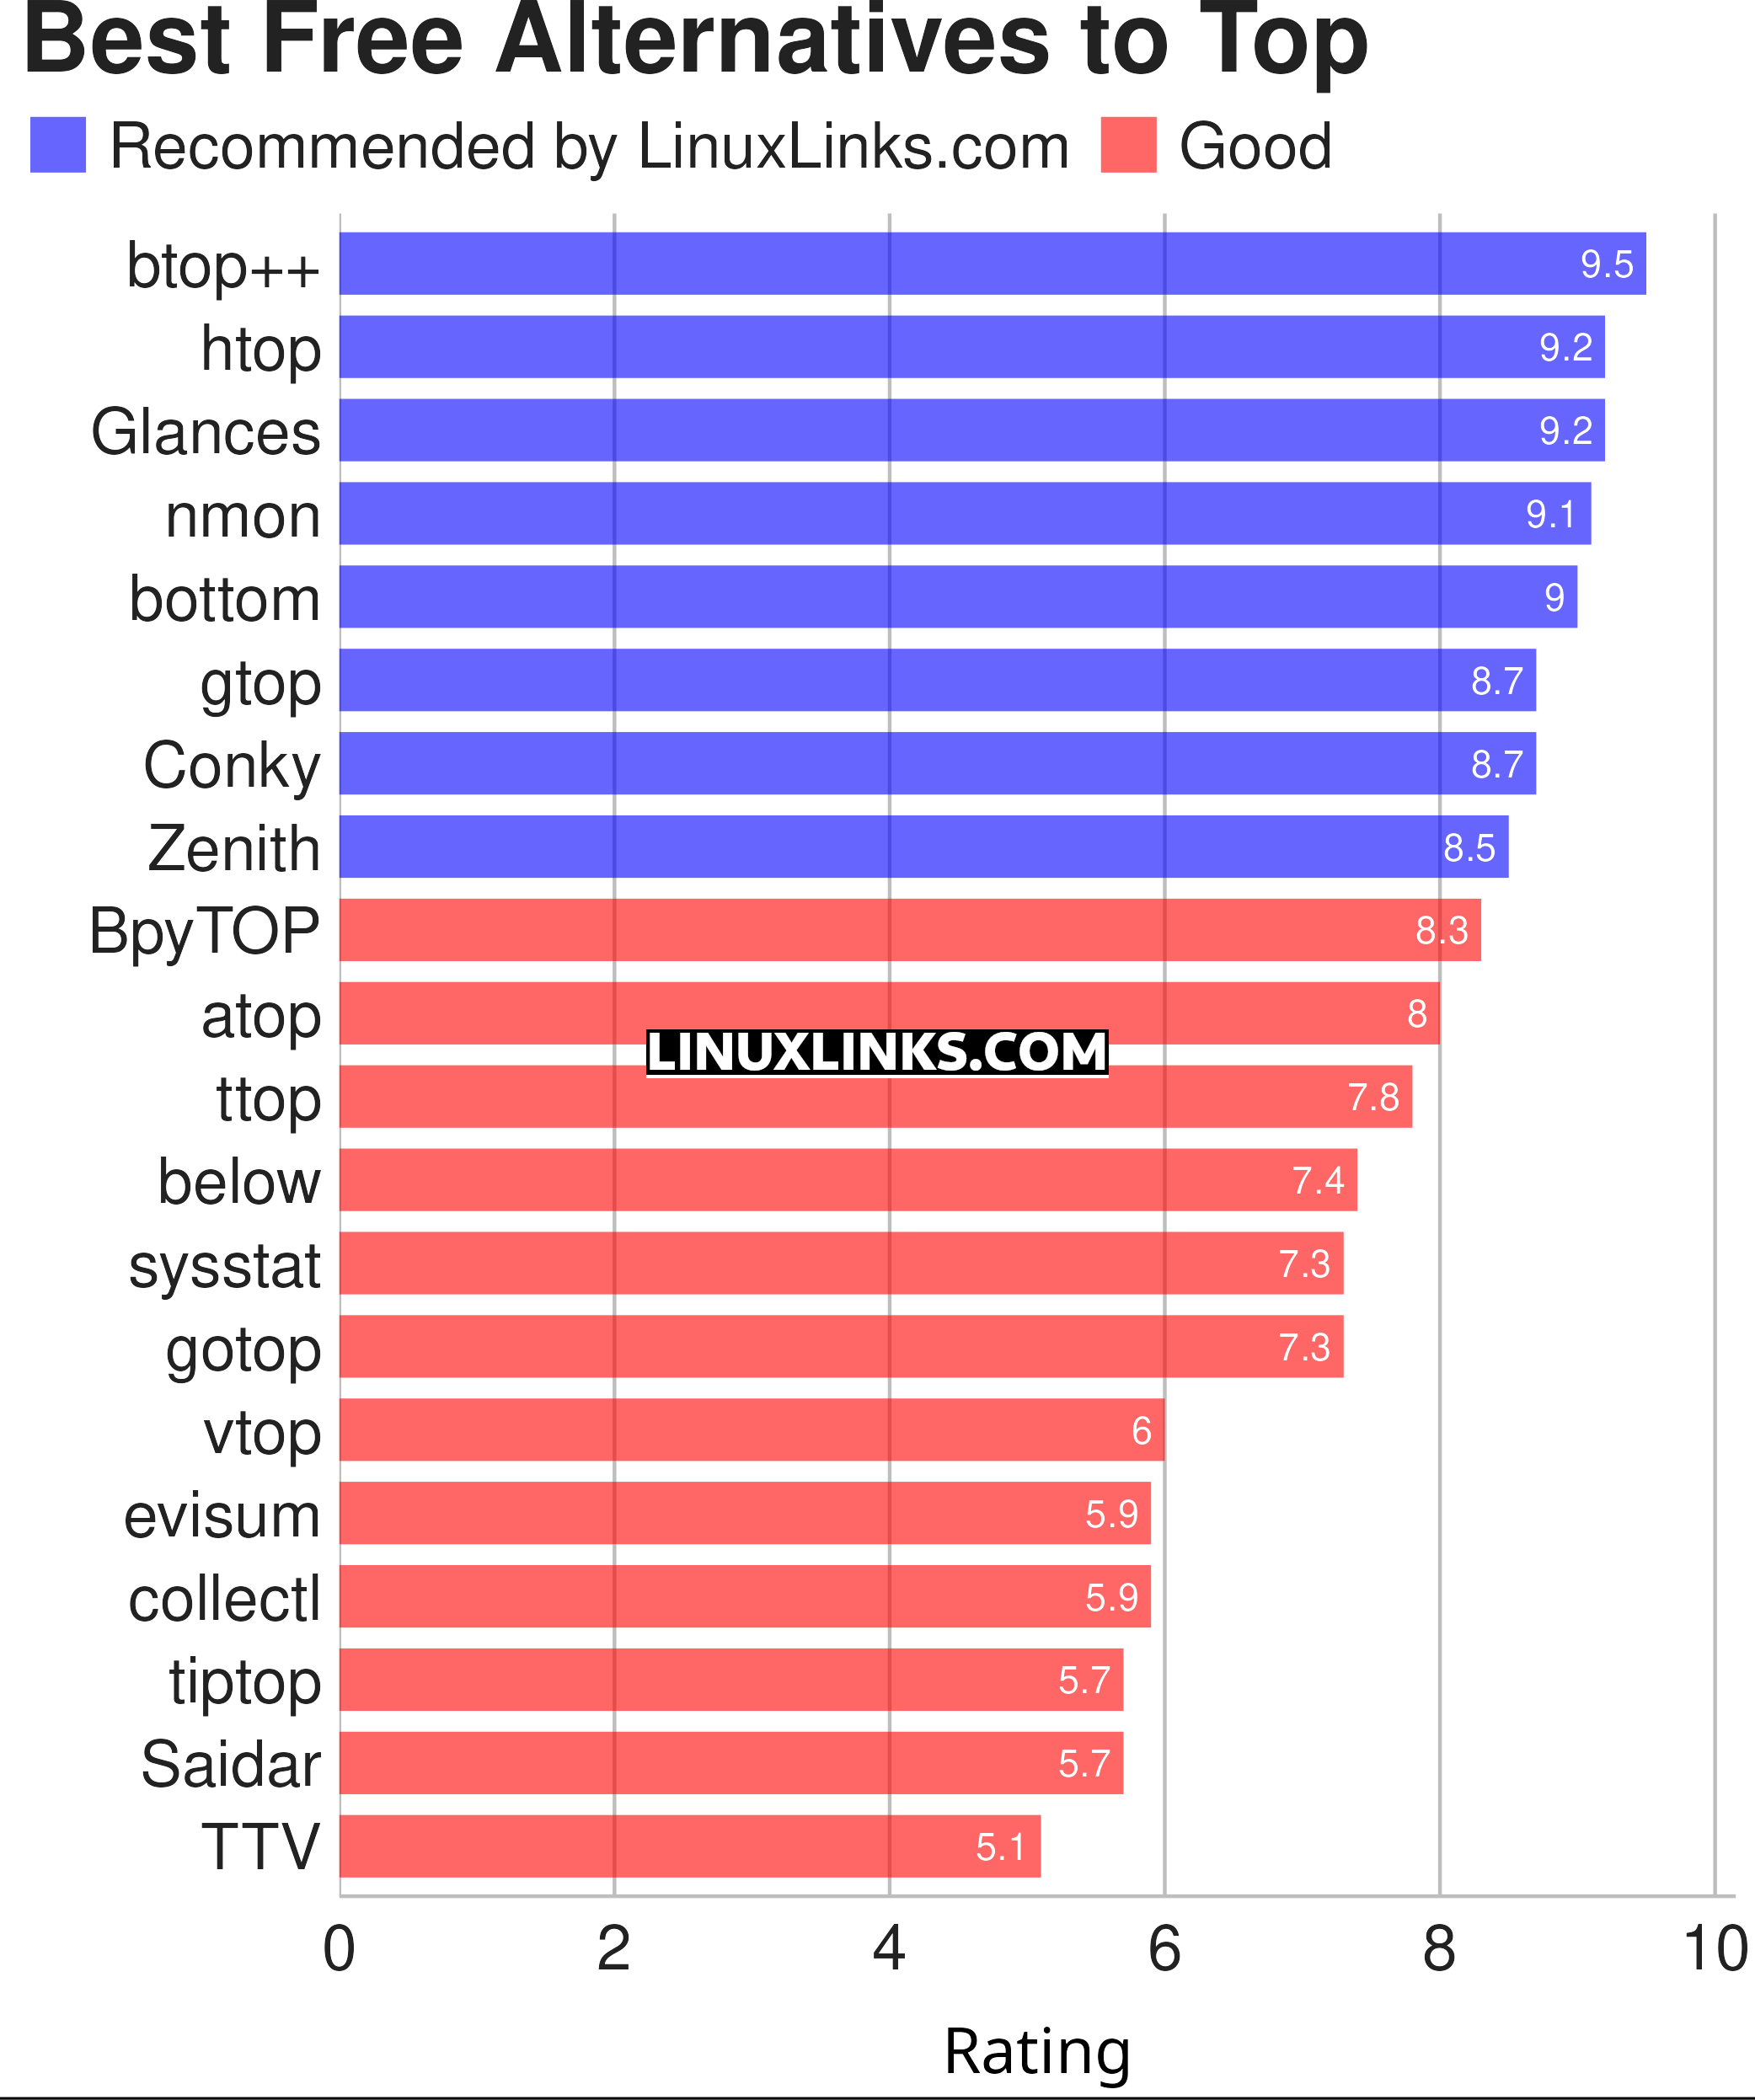
Here’s our rating for the featured open source software.

Let’s explore the 20 alternatives to top at hand. Click the links in the table below to learn more about each utility.
| Process Viewers | |
|---|---|
| btop++ | Continuation of bashtop and BpyTOP rewritten in C++ |
| htop | Provides a full list of processes running |
| Glances | System monitoring tool written in Python |
| nmon | Performance monitoring tool |
| bottom | Graphical process/system monitor seeking inspiration from gtop, gotop and htop |
| gtop | System monitoring dashboard for the terminal |
| Conky | Advanced, highly configurable system monitor for X based on torsmo |
| Zenith | Turbo-charged top utility |
| BpyTOP | Presents the system resources in a logical and well-thought out way |
| atop | Monitor for system resources and process activity |
| ttop | System monitoring tool with historical snapshots and alerts |
| below | Time traveling resource monitor |
| sysstat | System performance tools |
| gotop | Seeks inspiration from gtop and vtop |
| vtop | System monitoring tool in the spirit of top |
| evisum | Enlightenment system monitor |
| collectl | Collects data that describes the current system status |
| tiptop | Graphical activity monitor for the command line |
| Saidar | Displays live system statistics |
| TTV | Term-task-viewer |
This article has been revamped in line with our recent announcement.
All the CLI tools in this series.
| Alternatives to CLI tools |
|---|
| age // awk // bc // cal // cat // cd // chmod // cksum // cloc // cmp // compress // cp // cron // curl // cut // date // dd // df // diff // dig // du // fdisk // find // ftp // grep // gzip // hexdump // history // jq // kill // less // locate // ls // lsof // make // man // more // mv / ping // ps // psql // rename // rm // sed // split // ssh // strings // sudo // sysctl // tail // talk // tar // telnet // time // top // touch // traceroute // tree // uname // uniq // uptime // vi // watch // Wget // who // whois // xargs |
 Read our complete collection of recommended free and open source software. Our curated compilation covers all categories of software. Read our complete collection of recommended free and open source software. Our curated compilation covers all categories of software. Spotted a useful open source Linux program not covered on our site? Please let us know by completing this form. The software collection forms part of our series of informative articles for Linux enthusiasts. There are hundreds of in-depth reviews, open source alternatives to proprietary software from large corporations like Google, Microsoft, Apple, Adobe, IBM, Cisco, Oracle, and Autodesk. There are also fun things to try, hardware, free programming books and tutorials, and much more. |

I quite like smem. It’s not really a replacement for top as it only reports memory utilization, but worth a mention?
Consider it mentioned 🙂
PWatch provides a dynamic real-time view of running processes with historical graphs. The application is akin to well-know utility top. But while top is great for quick system overview, PWatch can be used to watch one or few processes closely.