How much faster is a P-Core compared to an E-Core?
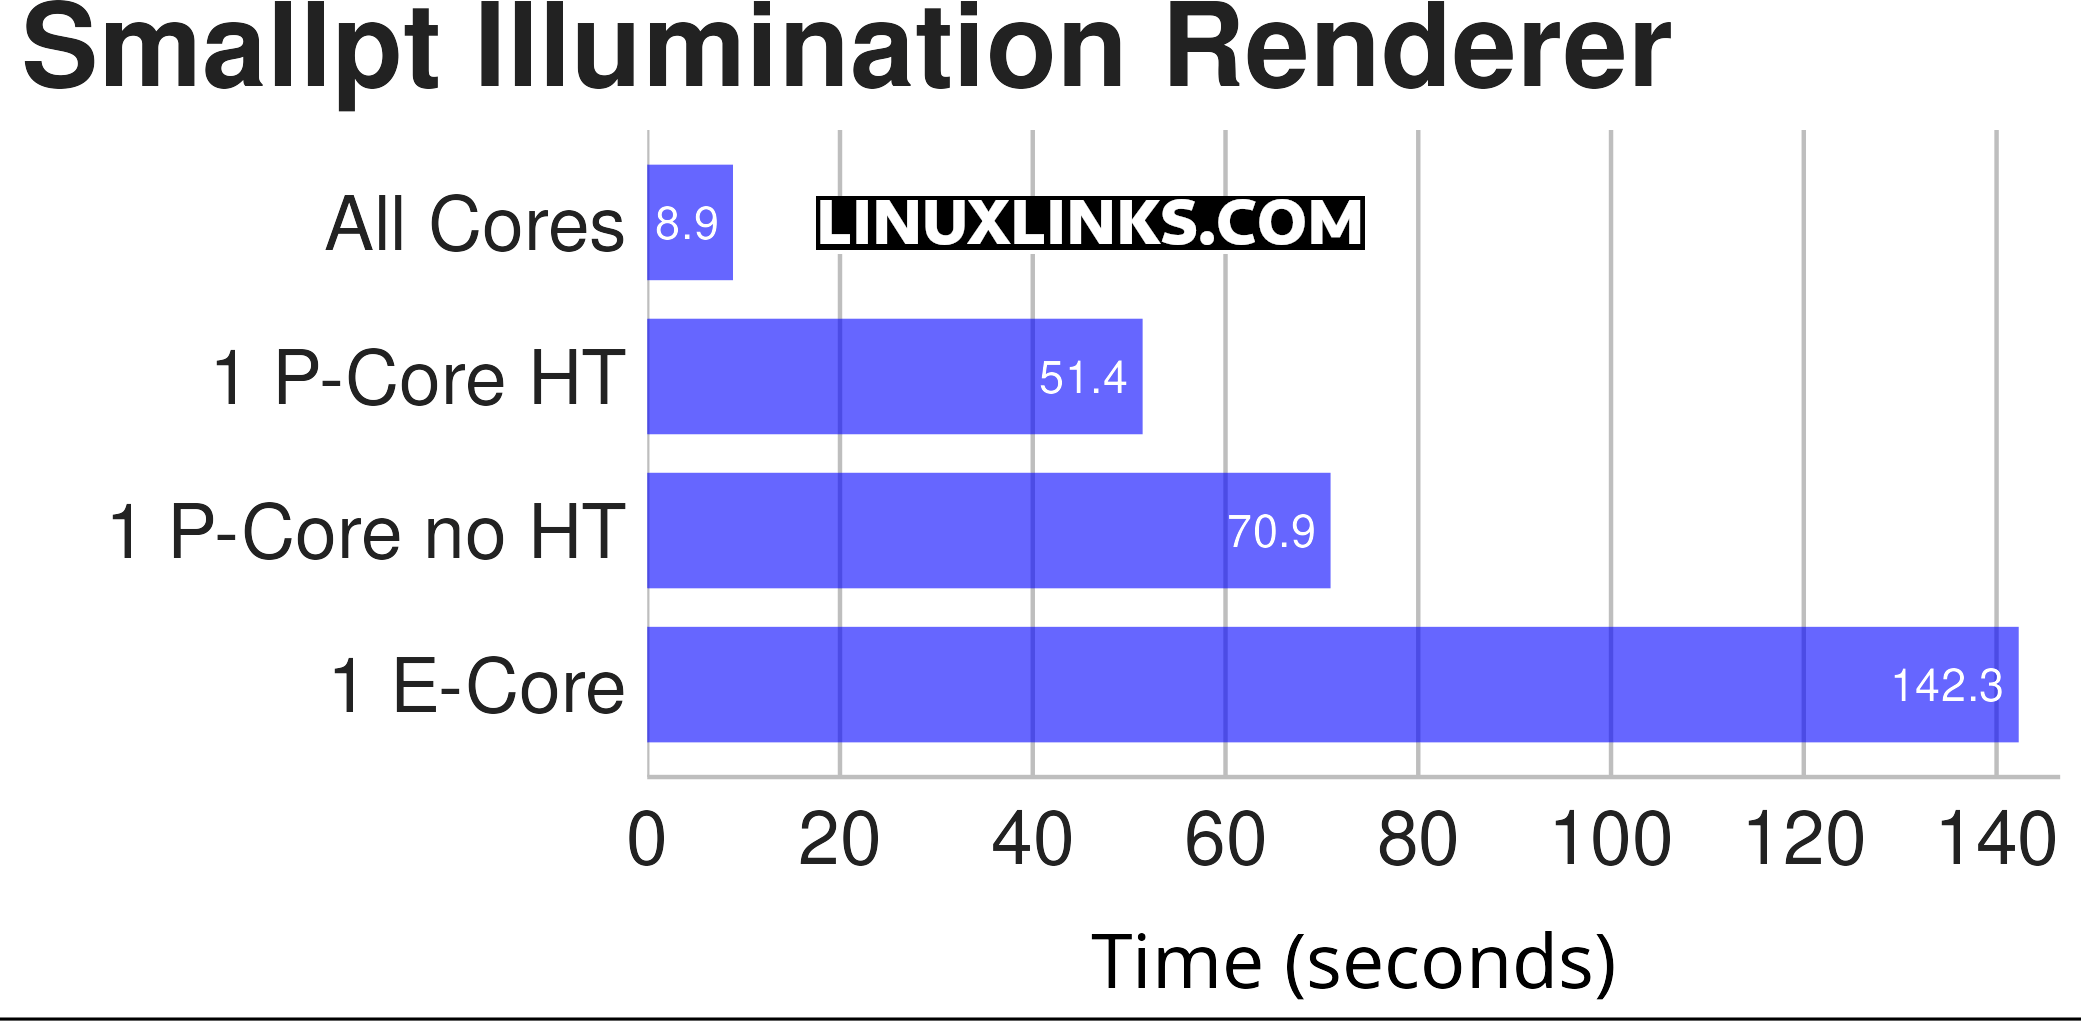
We ran the Smallpt benchmark using all cores, 1 P-Core with hyperthreading, 1 P-Core with no hyperthreading, and 1 E-Core.
$ phoronix-test-suite benchmark smalllpt # uses all P-Cores and E-Cores
$ taskset -c 0 phoronix-test-suite benchmark smallpt # uses 1 P-Core no HT
$ taskset -c 0,1 phoronix-test-suite benchmark smallpt # uses 1 P-Core with HT
$ taskset -c 8 phoronix-test-suite benchmark smallpt # uses 1 E-Core

As you can see 1 E-Core takes twice as long to complete the benchmark than 1 P-Core with no hyper-threading. The disparity between the 1 E-Core and 1 P-Core with no hyper-threading varies considerably depending on the workload. For example, an E-Core is only 50% slower running the crafty benchmark.
The Linux scheduler also supports natural CPU affinity: the scheduler attempts to keep processes on the same CPU as long as practical for performance reasons. We found that the crafty process run from the benchmark often doesn’t stick to the same P-core.
Next page: Page 4 – Forcing programs to run on the P-Cores or E-Cores
Pages in this article:
Page 1 – P-Cores and E-Cores
Page 2 – Interpret output from top
Page 3 – How much faster is a P-Core compared to an E-Core?
Page 4 – Forcing programs to run on the P-Cores or E-Cores
Complete list of articles in this series:
| Intel NUC 13 Pro Mini PC | |
|---|---|
| Part 1 | Introduction to the series with interrogation of system |
| Part 2 | Benchmarking the Mini PC |
| Part 3 | Installing Ubuntu 23.10 Desktop |
| Part 4 | Configuring Ubuntu 23.10 Desktop |
| Part 5 | Power Consumption |
| Part 6 | P-Cores and E-Cores |
| Part 7 | Gaming |
| Part 8 | Installing and Configuring Manjaro |
| Part 9 | BIOS options |
